
Fig. 7.
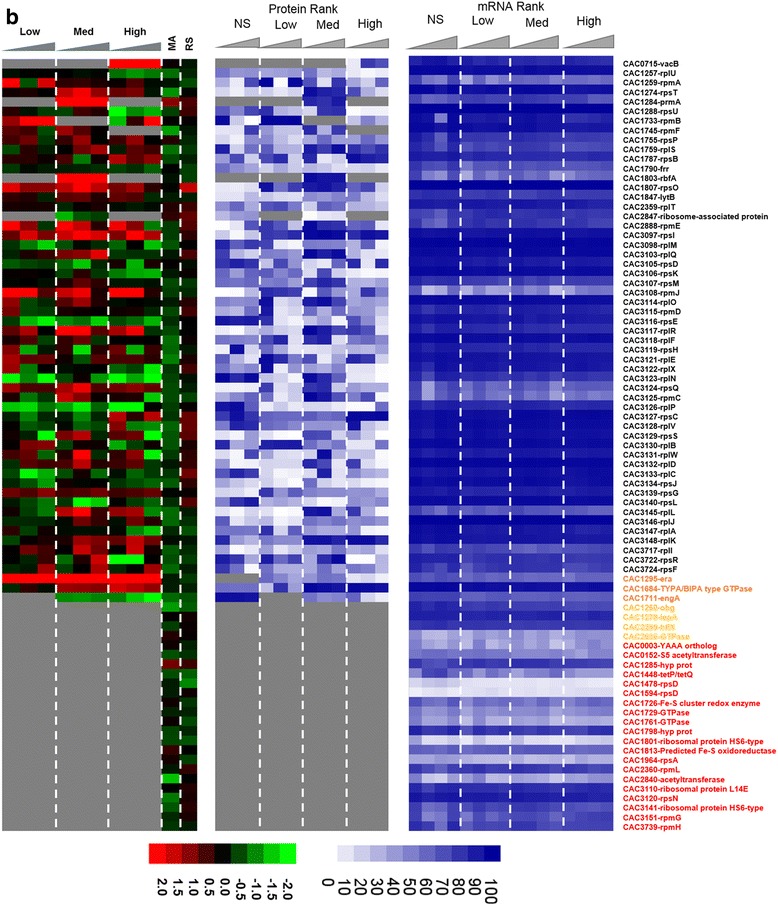
(continued) b butanol stress. The microarray (MA) and RNAseq (RS) values are displayed as average fold change across all time points. Proteins/genes are listed by genomic number and an abbreviated accepted name. Genes/proteins lacking expression were represented by gray color. Differential gene expression of stress versus non-stress control is displayed in red-green and protein and mRNA abundance percentile ranking is shown in blue plots. Legend font color: orange: accessory GTPases detected in proteomics; yellow: accessory GTPases NOT detected in proteomics; red: ribosomal proteins NOT detected in proteomics