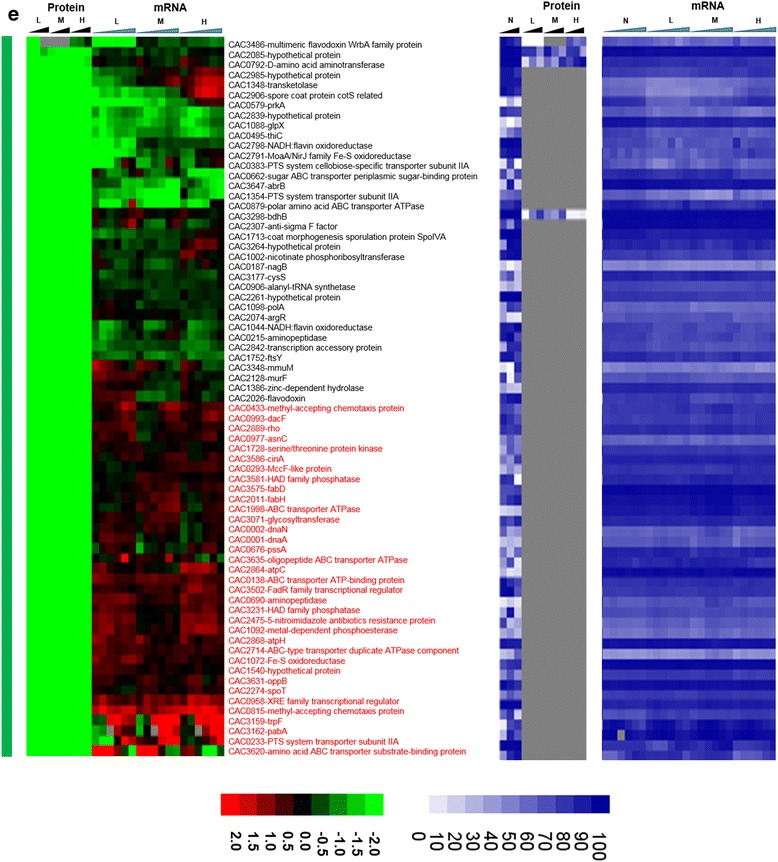
Fig. 3.

(continued) e proteins expressed only under non-stress control condition (green vertical bar). Genes that had a strong disagreement between mRNA and protein levels are represented in red font. Genes/proteins lacking expression (could not be detected with the methods used) and hence abundance ranking were represented by gray color
