Fig. 5.

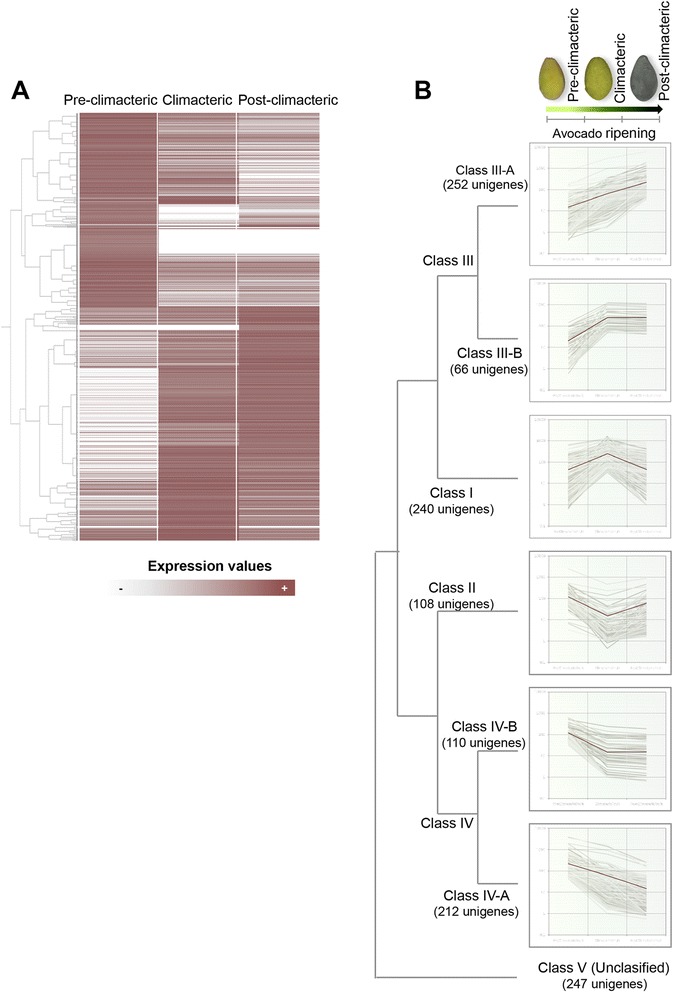
RNA-seq based transcriptome dynamics of avocado during fruit ripening. a The log2 of RPKM values for each gene was used for the hierarchical clustering analysis at each of the three selected ripening stages (pre-climacteric, climacteric and post-climacteric). b The 1235 differentially expressed unigenes were classified into 5 regulation patterns (classes I-V, respectively). Classes III and IV were subdivided into two sub-classes each. The graph shows the expression profile of unigenes for each class. Gray lines, expression profiles for individual unigenes. Brown lines represent the average intensities of unigene members of the clusters. For additional information, see Additional file 4: Table S10
