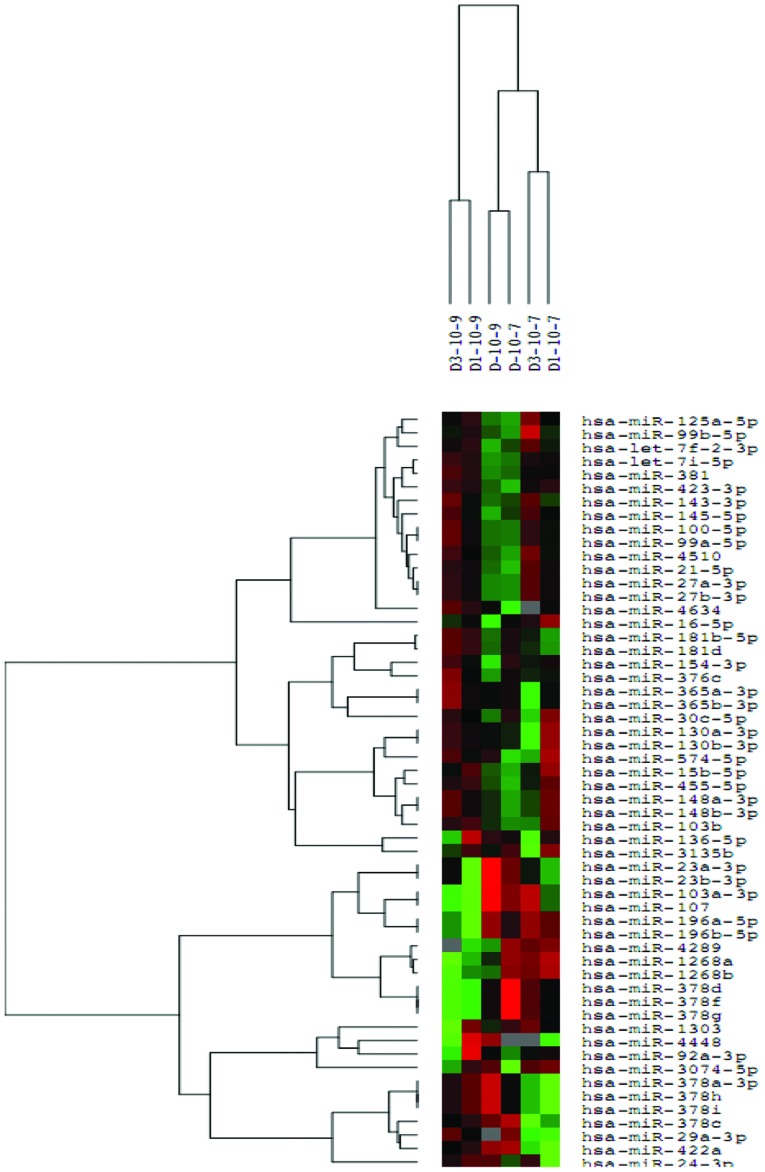
Figure 7.
A heat map according to the statistical analysis. The green color represents the downregulation of microRNAs (miRNAs), and the red color represents the upregulation of miRNAs. The expression of miRNAs in the cells treated with 10−7 mol/l dexamethasone was different from that observed in the controls.

