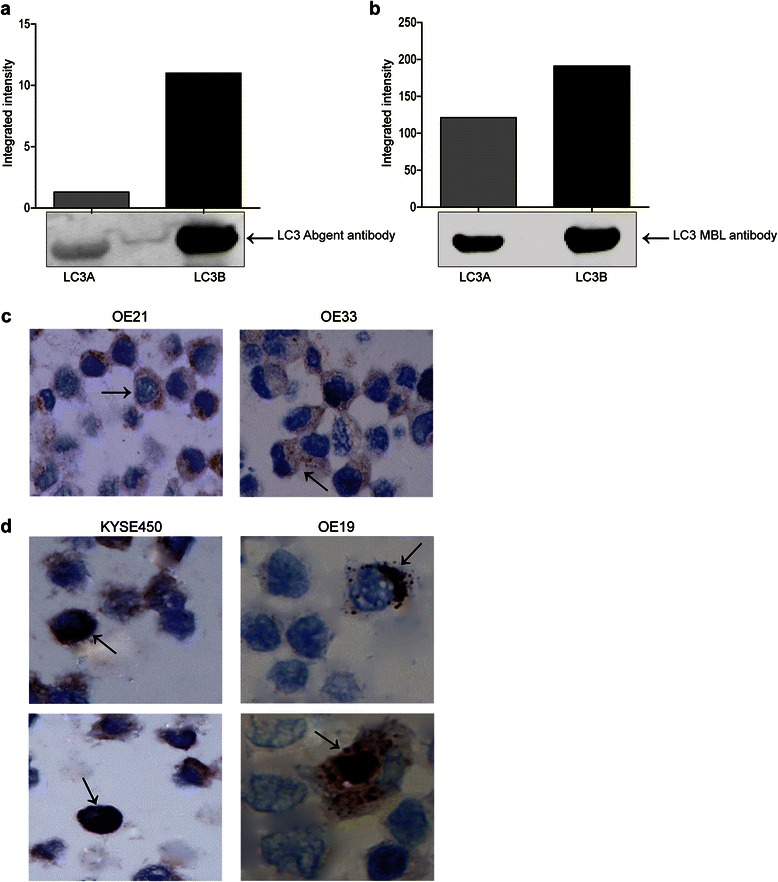
Fig. 1.

Western blot analysis of human recombinant microtubule-associated proteins 1A/1B light chain 3A and 3B probed with either a the Abgent anti-LC3 antibody (AP1802a), or b MBL anti-LC3A/B antibody. LC3 bands were quantified using the Odyssey Infrared Imaging System (Li-Cor), and data presented as integrated intensities (n = 3). c Analysis of LC3B distribution in untreated OE21 and OE33 esophageal cancer cell lines. Arrows indicate diffuse cytoplasmic LC3B expression (magnification 400×) (n = 6). d Analysis of LC3B distribution in untreated KYSE450 and OE19 esophageal cell lines. Arrows indicate the presence of LC3B crescent or ring-like (upper panels) and globular (lower panels) structures in KYSE450 and OE19 cells (magnification 1000×) (n = 6)
