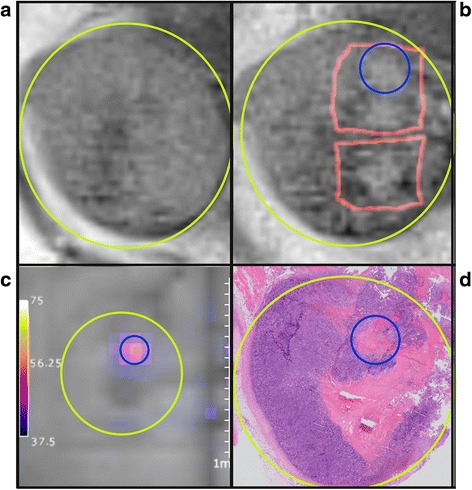
Fig. 5.

Comparison of the tumor on magnetic resonance (MR) imaging and pathology. T2 weighted (T2W) MR images before (a) and immediately after (b) 3 ablation spots. Yellow circle is the tumor, red squares are the thermal dose overlay. c:Temperature map (echo planar imaging (EPI) sequence) of one focal spot corresponding with blue circle at pathology and T2W image after treatment. d hematoxilin and eosin slice of the tumor 3 days after treatment. Showing a focal necrotic region and a confluent necrotic region, caused by heat distribution resulting in fusion of the lesions in the days after treatment
