Fig. 5.

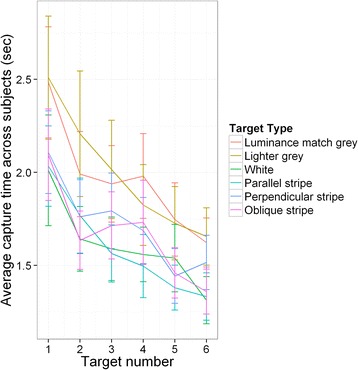
Average time between capture of successive targets in Experiment 2. Results are plotted as a function of target type. Error bars are the standard error of the mean

Average time between capture of successive targets in Experiment 2. Results are plotted as a function of target type. Error bars are the standard error of the mean