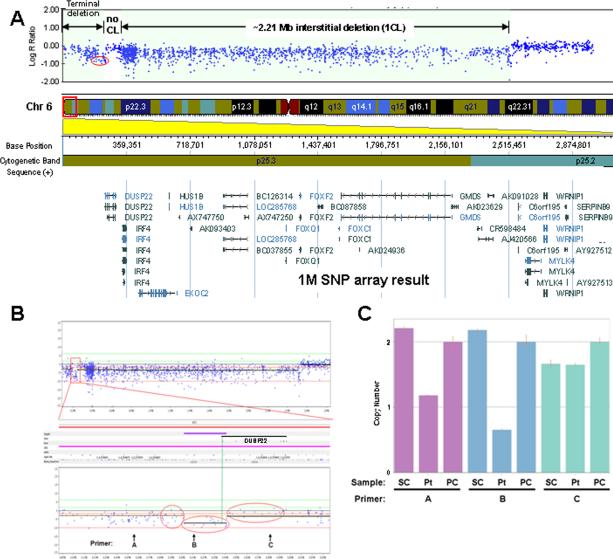
FIG. 4.
SNP array and TaqMan® copy number analyses of patient's DNA. A: SNP array result showing the ~2.21 Mb region of interstitial deletion, a more telomeric region of ~80 kb with maintenance of genomic copy number, and the most terminal region of genomic loss. The red oval delineates probes in the 5′ region of DUSP22 used to further explore potential copy number losses in the region and compare with 244K aCGH result in Figure 3B. CL, copy loss. B: SNP array analysis using Nexus Copy Number version 5 software from BioDiversity, Inc. (El Seguando, CA). Three sets of 16 probes within the red ovals were statistically analyzed for difference in log2 R ratios (i.e., copy number value differences; see the Results Section). The region defined by the central oval is 5′ of DUSP22 and partially overlaps the 5′ end of the DUSP22 genomic boundary (green vertical line showing the 5′ DUSP22 boundary). Positions of primers A, B, and C used in the TaqMan® copy number assay (below) are indicated with coordinates Chr6: 155,627–155,651 (hg18), Chr6: 210,832–210,856 (hg18), and Chr6: 280,147–280,171 (hg18), respectively. C: TaqMan® copy number assay of patient's DNA versus control DNA from normal individuals. Coordinates for primers A, B, and C noted as above. SC and PC represent control (single) normal individual DNA sample (co-author RKI) and control (pooled) DNA sample from 10 normal individuals (used by MMGL), respectively. Pt; patient DNA.

