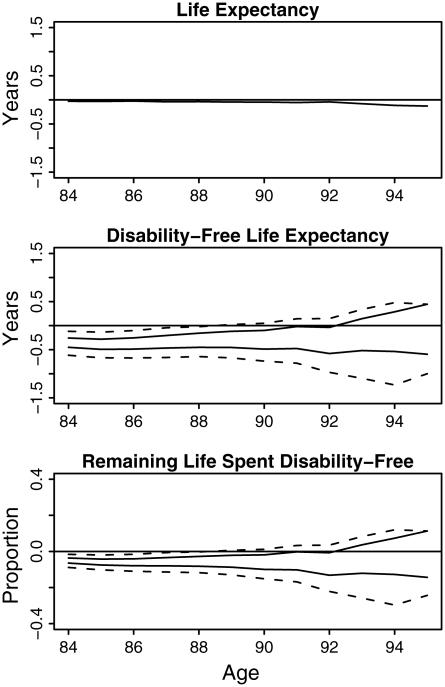
Figure 2.
Comparison between the 1991 period and 1907 U.S. birth cohorts. The upper, middle, and lower panels compare the difference in life expectancy, DFLE, and the proportion or remaining life spent disability-free (i.e., 1991 period minus 1907 birth cohort). The estimated bounds of the differences are shown. The 95% balanced confidence intervals are calculated from the bootstrap method and shown as dashed lines.

