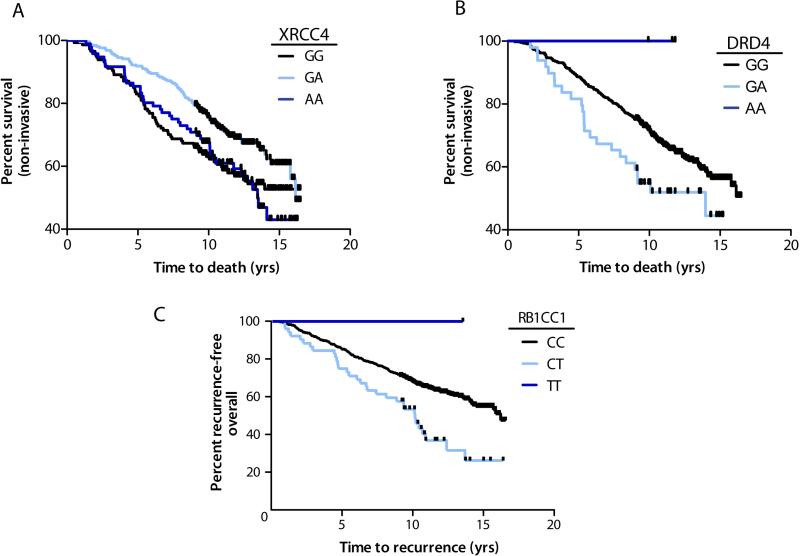
Fig. 2.
Bladder cancer survival by SNP genotype. Kaplan-Meier plots depict the percent of patients by the time to death in years. Shaded lines separate patients by genotype for a) XRCC4 rs2662238 restricted to patients with non- invasive tumors, logrank P=0.018, b) DRD4 rs4987059, restricted to patients with non- invasive tumors, log-rank P=0.041, and c) RB1CC1 rs35402311 among all patients, log-rank P=0.001. Vertical hatches represent censoring due to end of follow-up period.

