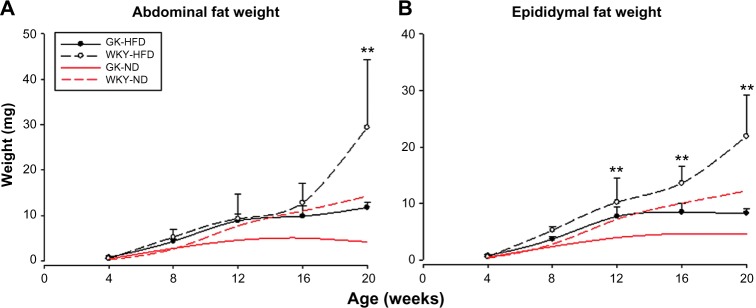
Figure 1.

Adipose tissue weights at sacrifice as a function of age in GK animals (closed circles) and WKY animals (open circles) when animals are fed a high fat diet (black lines). Symbols represent means and error bars of one standard deviation. Red lines represent comparable data obtained from animals fed a normal diet and are provided for reference. (A) Abdominal fat pads; (B) Epididymal fat pads.
Notes: **WKY-HFD vs GK-HFD, P < 0.001.
