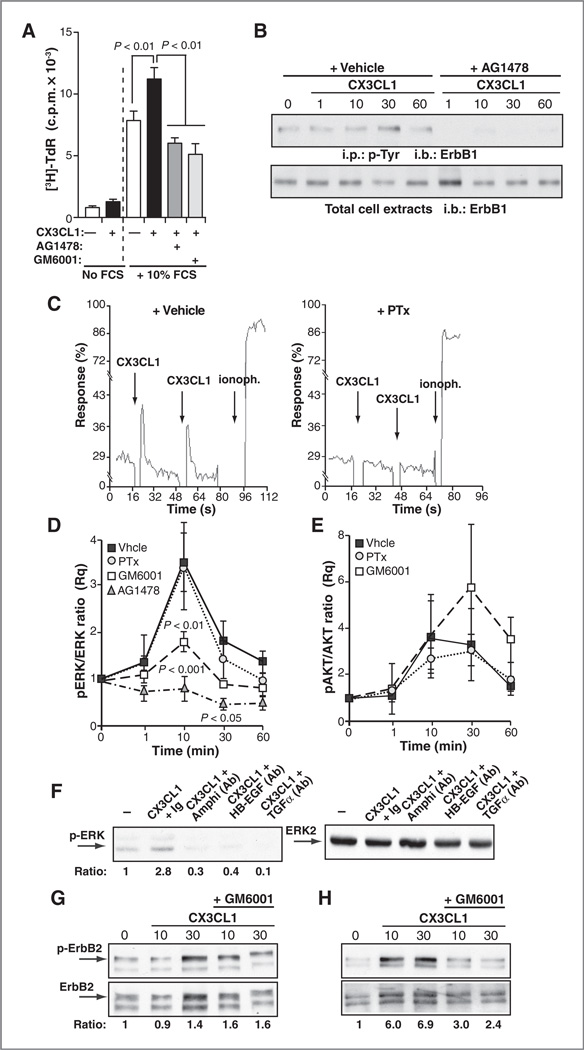
Figure 5.
CX3CL1 induces transactivation of the EGF pathway in tumors and breast epithelial cells. A, [3H]-TdR incorporation in T47D cells, unstimulated (−) or stimulated with CX3CL1, with or without FCS and the indicated inhibitors. Data are mean ± SEM counts per minute (c.p.m.) from octuplicates in a representative experiment (n = 2 without FCS; n = 5 with FCS; one-way ANOVA, Dunnett posttest). B, CX3CL1-induced tyrosine phosphorylation of ErbB1 in T47D cells stimulated with the chemokine for the indicated times, alone or with AG1478. Cell extracts were precipitated with anti-phosphotyrosine (p-Tyr) antibody (top) or directly resolved by SDS-PAGE and blotted with anti-ErbB1 (bottom); a representative experiment of two is shown. C, CX3CL1-induced Ca2+ flux in vehicle- or PTx-treated T47D cells loaded with Fluo-3, AM (n = 2). D and E, analysis of CX3CL1-induced ERK (D) and AKT (E) activation in T47D cells pretreated with inhibitors and stimulated with CX3CL1 for indicated times. Phosphorylated ERK 1/2 and AKT and total ERK and AKT were determined in cell extracts. pERK/ ERK (D) and pAKT/AKT (E) ratios were calculated by densitometry and normalized to unstimulated conditions. Data are mean ± SEM (n = 4; two-way ANOVA with Bonferroni posttest). F, blockade of CX3CL1-induced ERK phosphorylation by neutralizing antibodies to the indicated ErbB ligands. Numbers (bottom) indicate the pERK/ERK ratio for each condition. G and H, analysis of CX3CL1-induced ErbB2 phosphorylation in primary cultures of Tg-neu tumors (G) or mammary epithelial cells (H). Representative blots of CX3CL1-stimulated tumors or breast epithelial cells, alone or with GM6001 (n = 2, tumors; n = 3, normal epithelium). Numbers (bottom) indicate the pErbB2/ ErbB2 ratio for each condition. i.p., immunoprecipitation; i.b., immunoblotting.

