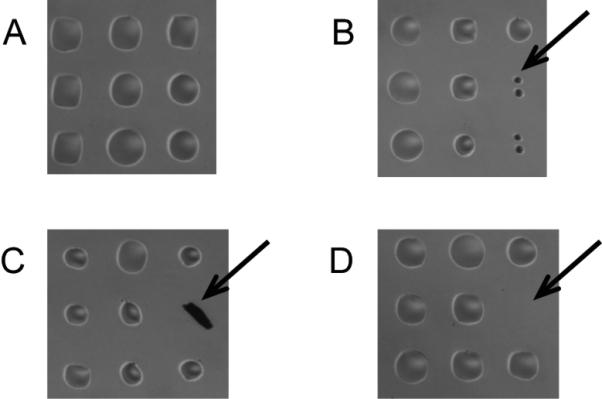
Figure 3. Microscope images of printed arrays.

The figure shows magnified portions of arrays after printing but prior to an assay. (A) High quality printing produces uniform spots evenly spaced on the glass surface, which is free of debris. (B) Small spots may be due to a partially clogged pin or low volume of sample in the pin due to poor pin loading or excessive pre-spotting. (C) Debris on the surface may have no or high signal, depending on its fluorescence. (D) Missing spots are typically due to pin sticking.
