
Figure 4. Scans of processed arrays.
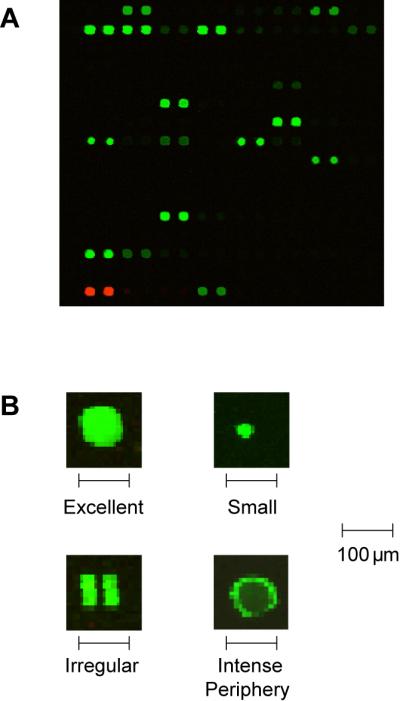
Examples of images scanned using a fluorescence scanner. (A) High quality results show circular spots of varying intensity but uniform size. (B) Under higher magnification, high quality spots have homogeneous intensity throughout the spot, and duplicate spots have nearly identical intensity. Printing and processing problems can result in variations in intensity across individual spots, irregular spot morphology, or missing spots.