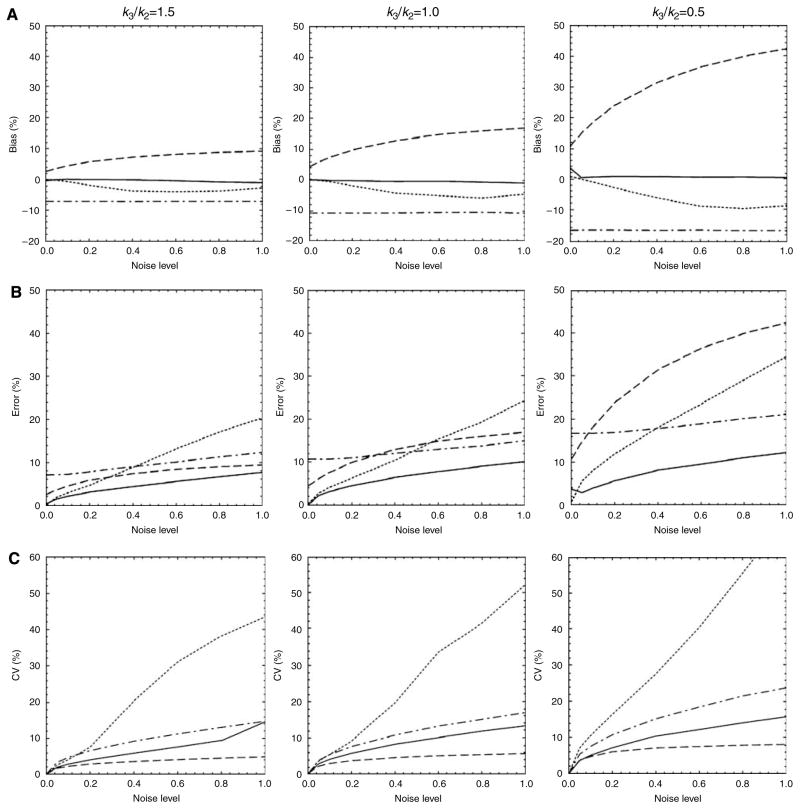
Figure 1.
Plots of (A) biases, (B) errors, and (C) coefficients of variation (CV) for the estimation of Kin versus noise level (α) from simulated time–activity curves for high (left column), intermediate (middle), and low (right) receptor density regions (k3/k2=1.5, 1.0, and 0.5, respectively). NLS: solid line; MLAIR1: dotted; MLAIR2: dashed; GPGA: dash-dot.

