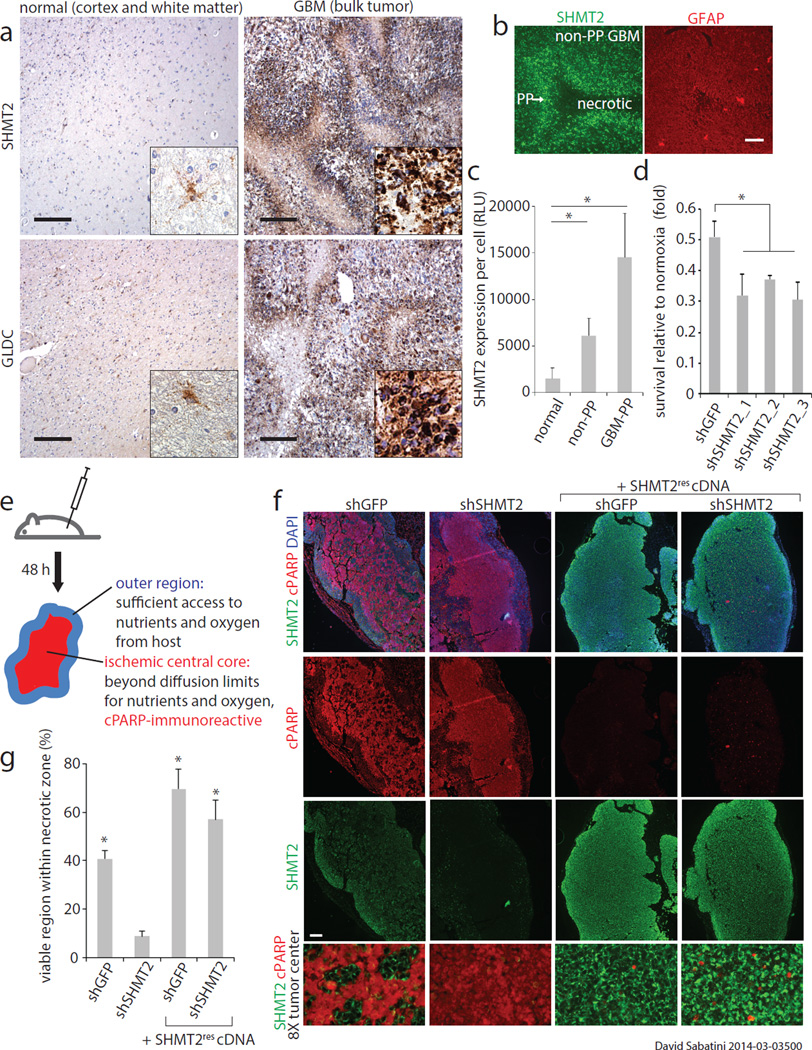
Figure 3. SHMT2 expression provides a survival advantage in the ischemic tumor microenvironment.
a, SHMT2 and GLDC expression in normal human brains and GBM tumors. Insets are 5× fold magnifications. Representative images are shown; comprehensive histological analyses are in Extended Data Figure 5. Scale bar = 200 µm. b, SHMT2 immunofluorescence in the cells in the pseudopalisades (PP) and in the non-pseudopalisade GBM regions. Glial fibrillary acidic protein (GFAP), a general GBM cell marker, does not show increased signal in pseudopalisades. c, Quantification of SHMT2 expression, measured as fluorescence intensity per cell, in normal brain regions, non-pseudopalisade GBM regions, and pseudopalisade regions (n=5 patient samples per group). Error bars are SD. d, Cell number counts from LN229 cells expressing shRNAs against GFP or SHMT2 and cultured in 0.5% hypoxia for 8 days. Values are relative to the counts of the same cells cultured in parallel in normoxia; n=3 independent biological replicates; error bars are SD. e, Schematic of experimental design for rapid xenograft model. f, Representative micrographs of rapid xenograft tumors formed by LN229 cells transduced with indicated shRNAs and cDNAs, and immunostained for SHMT2 and cleaved PARP. Bottom row shows 8× magnified, merged images of the central tumor region, displayed without DAPI channel for clarity. Scale bar = 200 µm. g, Quantification of the percentage of cleaved PARP-negative, viable area within the central necrotic region of xenografts of as shown in f. Error bars are SEM (shGFP, n=10; shSHMT2_1, n=9; shGFP+SHMT2rescDNA, n=8; shSHMT2_1 +SHMT2rescDNA, n=8; each n is a xenograft tumor). For all panels, *P<0.05 (student’s t test).

