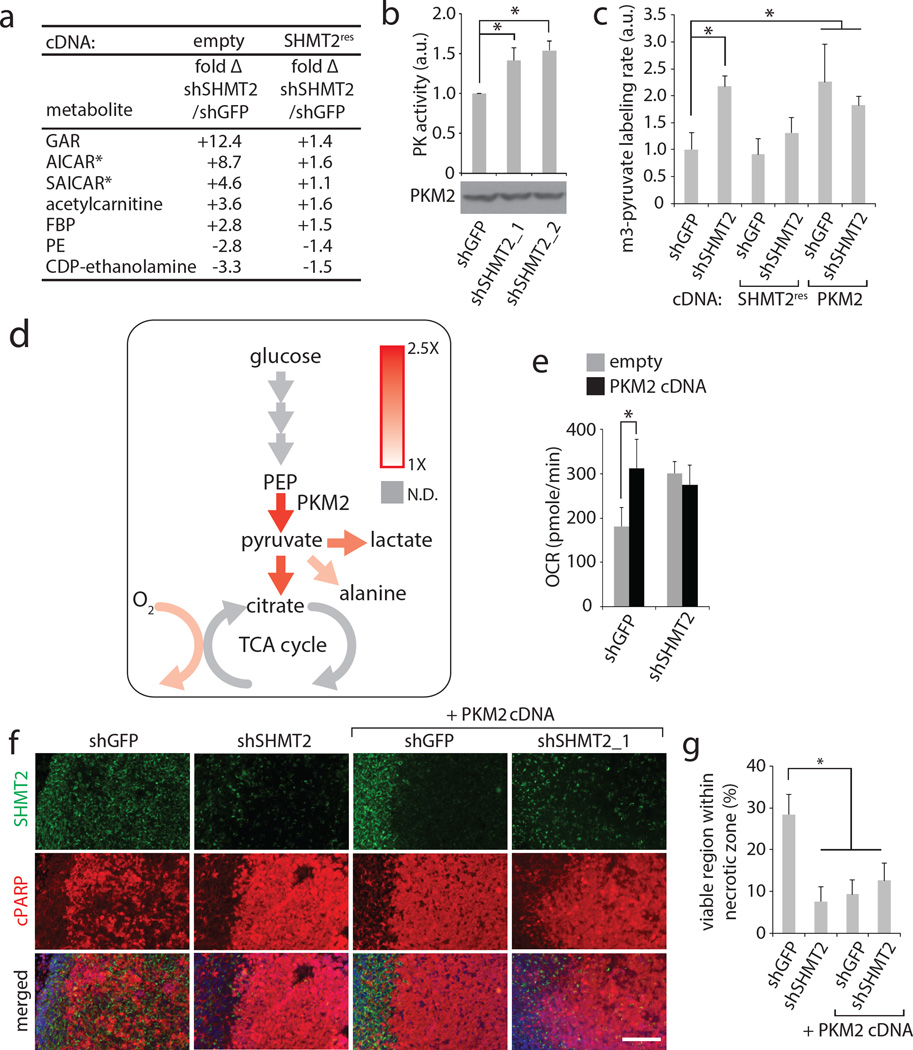
Figure 4. SHMT2 elicits a PKM2-dependent metabolic rewiring that is advantageous to cancer cells in an ischemic environment.
a, Liquid chromatography-mass spectrometry (LC-MS) based, untargeted discovery of metabolites that change in abundance following SHMT2 knockdown in LN229 cells. GAR- glycineamideribotide; FBP – fructose bisphosphate (either 1,6 or 2,6; cannot be distinguished by LC-MS); PE- phosphoethanolamine. Differential peaks were identified and quantified as described in the Methods, and the metabolites with largest change are listed. Metabolite levels are relative and are expressed as fold change in cells transduced with shSHMT2_1 versus cells transduced with shGFP, with or without the RNAi-resistant SHMT2 cDNA. All differences in first column are significant (P<0.05). b, Pyruvate kinase activity assay from lysates of LN229 cells transduced with indicated shRNAs. c, m3-pyruvate labeling rates in LN229 cells transduced with shRNAs and cDNAs as indicated, and fed [U-13C]-glucose media. d, Summary diagram of labeling rate changes seen as a result of SHMT2 silencing. Colored arrows indicate increased flux according to the heat map, while gray arrows indicate non-determined labeling rates. Detailed analyses are in Extended Data Fig. 5. e, Oxygen consumption in LN229 cells (in RPMI) expressing shGFP or shSHMT2_1 with or without PKM2 cDNA. Error bars are SD (n=5 technical replicates). f, Representative micrographs of rapid xenograft tumors formed from LN229 cells stably expressing indicated shRNAs and cDNAs, and immunostained for SHMT2 and cleaved PARP. Viable regions are oriented on the left, and the central ischemic regions on the right. Scale bar = 100 µm. g, Quantification of the percentage of cleaved PARP-negative, viable area within the central necrotic region of xenografts of as shown in f. Error bars are SEM (shGFP, n=10; shSHMT2_1, n=8; shGFP+PKM2 cDNA, n=10; shSHMT2_1 + PKM2 cDNA, n=6; each n is a xenograft tumor). For a,b, and c, n=3 independent biological replicates; error bars are SD. For all panels, *P<0.05 (student’s t test).

