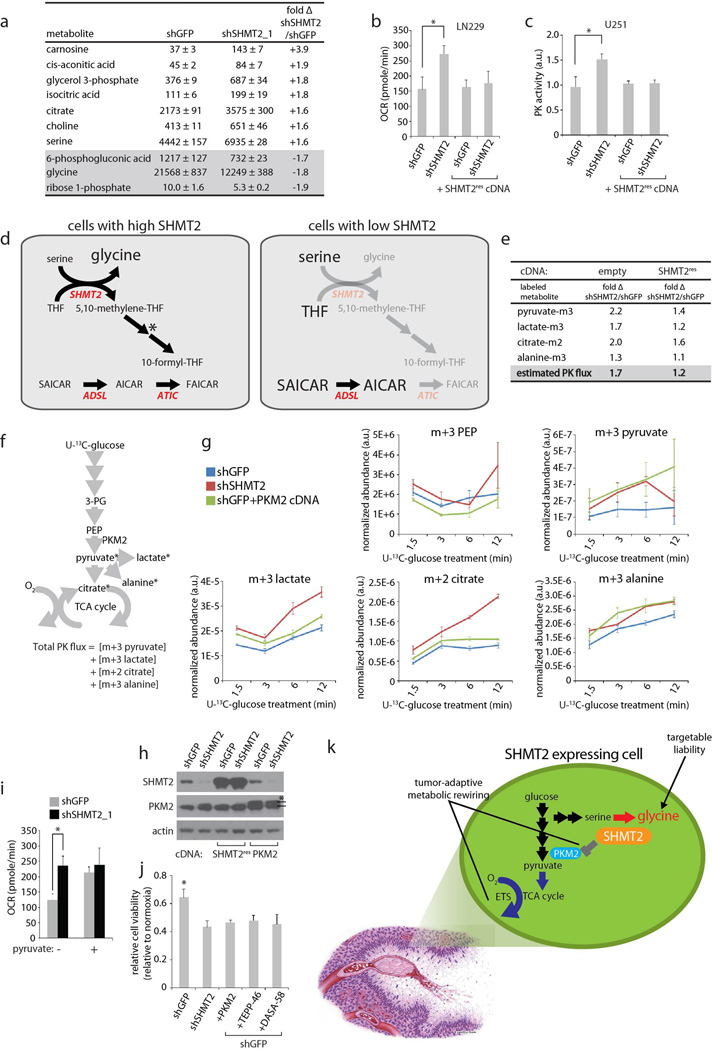
Extended Data Figure 5. Effects of SHMT2 expression on PKM2 activity and cell metabolism.
a, Absolute quantitative CE-MS measurement of intracellular metabolites from LN229 cells stably expressing indicated shRNAs without media change for 84 hours. The metabolites with the greatest fold change are listed, in units of pmol/106 cells. All metabolites listed are changed in a statistically significant manner (student’s t test, P<0.05). Data for all 116 metabolites in the analysis are in Supplementary Table 4. b, Oxygen consumption in LN229 cells (in RPMI media) transduced with indicated shRNAs and cDNAs. Error bars are SD (n=4 technical replicates). c, Pyruvate kinase activity assay from lysates of U251 cells transduced with indicated shRNAs or cDNAs. d, Proposed mechanism by which SHMT2 inhibition could lead to an increase in AICAR and SAICAR. In cells with high SHMT2 expression, 10-formyl-THF, which is a downstream product of SHMT2 activity, serves as a cofactor for cytosolic 5-aminoimidazole-4-carboxamide ribonucleotide formyltransferase (ATIC) in the conversion of AICAR to FAICAR during purine biosynthesis. In the absence of SHMT2, a lack 10-formyl-THF production could lead to accumulation of AICAR and SAICAR. As indicated by the asterisk, the contribution of SHMT2 to cytosolic 10-formyl-THF formation may be direct, occur via export of formate from the mitochondria, or occur indirectly by changing serine/glycine levels and thereby altering SHMT1 activity. e, 13C labeling rates of pyruvate and its downstream metabolites in cells from e. Labeling rates are relative and expressed as fold changes in cells transduced with shSHMT2_1 versus cells transduced with shGFP, with or without RNAi-resistant SHMT2 cDNA. Estimated PK flux is the calculated total flux to the four product species in moles of 13C per unit time. Plots for individual labeled species over time are shown in Extended Data Figure 5d and Supplementary Table 9. f, Scheme for calculating total PK flux by measuring the net molar labeling of [U-13C]-glucose derived, PK product species. Estimated PK flux is the calculated total flux to the four product species in moles of 13C per unit time. g, Plots of glucose-derived labeled species abundance over time for shGFP, shSHMT2, and shGFP plus PKM2 cDNA expressing LN229 cells shown in Fig. 4e–g. Raw data, calculations and plots for all stable cell lines are shown in Supplemental data tables 8 and 9. h, SHMT2 and PKM2 expression in LN229 cells transduced with shRNAs and cDNAs as indicated. Asterisk indicates the overexpressed PKM2, which shows higher migration due to Flag tag. i, Oxygen consumption in LN229 cells expressing shGFP or shSHMT2_1 in RPMI media with or without 1 mM pyruvate. Error bars are SD (n=4 technical replicates). j, Viability of LN229 cells transduced with shRNAs or cDNAs as indicated, and also treated with vehicle or 50 uM of TEPP-46 or DASA-58 as indicated, then subjected to hypoxia for 6 days. Values are relative to the same cells grown in parallel in normoxia. k, Overview of effects of SHMT2 expression on cell metabolism, tumor cell survival, and liability to toxic glycine accumulation. Red arrow indicates upregulation, and blue arrow indicates downregulation. Gray bar indicates the inhibitory effect of SHMT2 activity on PKM2 activity. Depiction of pseudopalisading necrosis is adapted from a previous review (Brat and Meir, Laboratory Investigation 84(4):397–405). Illustration by Mica Duran. For a,c,e,g, and j, n=3 independent biological replicates; error bars are SD. *P<0.05 (student’s t test).

