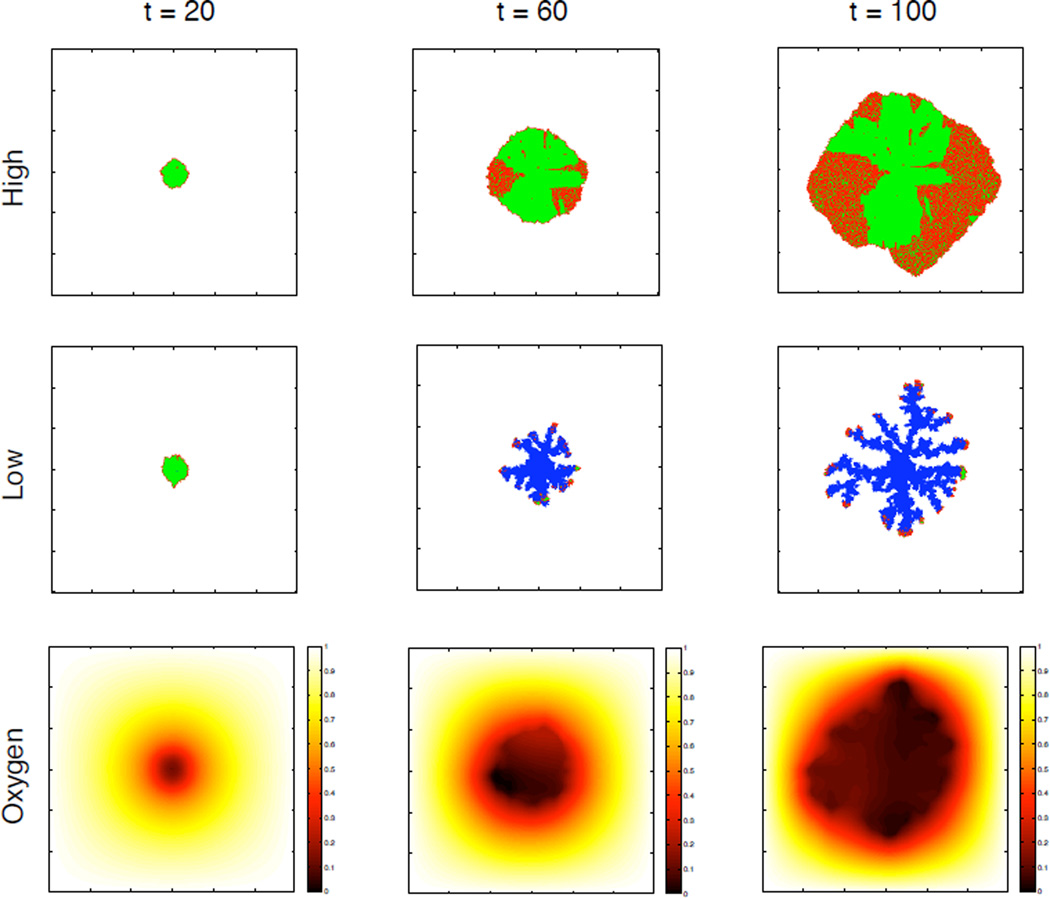
Figure 3.
The two upper rows show the spatial distribution of cells at t =20, 60 and 100 days. Proliferating cells are coloured red, quiescent green and dead cells are blue. We can see a clear difference in the morphology of the tumours in the low and high oxygen case. The lower row shows the oxygen concentration in the low oxygen case.

