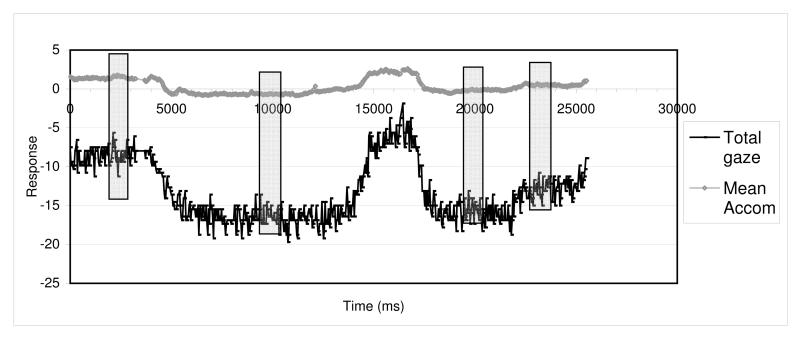
Figure 4.
Example of vignette identification. Plots of partially processed data (before degrees converted to metre angles and angle lambda corrected) used for vignette identification. Responses against time (x-axis) to identify target position and continuous data sections. y-axis scale in dioptres for accommodation and degrees for vergence. Vignettes of 25 continuous data points were selected (shaded) to represent a sample of stable response at each fixation distance

