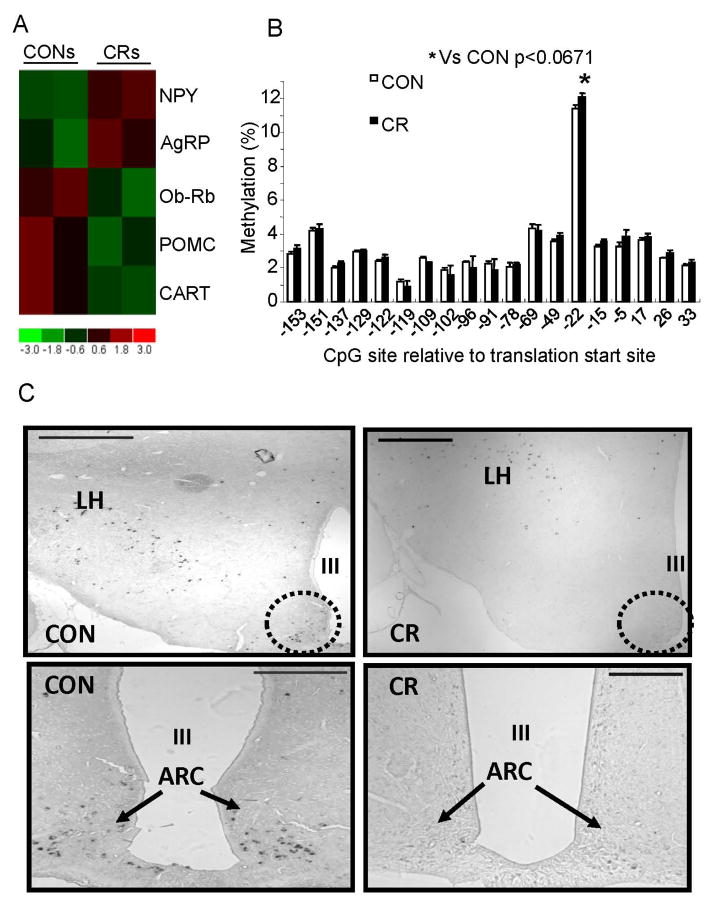
Figure 3. Hypothalamic gene expression profiles, DNA methylation of hypothalamic CART promoter region and CART gene expression in CON and CR groups.
A. Microarray analysis: Orexigenic (NPY and AgRP) and anorexigenic (POMC and CART) neuropeptides including leptin receptor gene, ObRb, expression by microarray analyses is shown. Heat map displays CONs (left two columns) and CRs (right two columns) labeled at the top. At the bottom is shown the heatmap index, with red indicating up-regulation as compared to control (CONs); green down-regulation as compared to control (CONs). NPY and AgRP were increased while POMC and CART were decreased in CRs compared to CONs. B. DNA methylation of the CART gene: Genomic DNA from the hypothalamic CART promoter region was analyzed for differential methylation by bisulfite conversion and pyrosequencing.*p< 0.067 compared to CON. C. In situ hybridization histochemistry, demonstrates CART gene expression (arrows point to the black staining) in the arcuate nucleus (dotted circle) of CON and CR groups. LH = lateral ventricle, III = third ventricle. Scale bars = 200 μm

