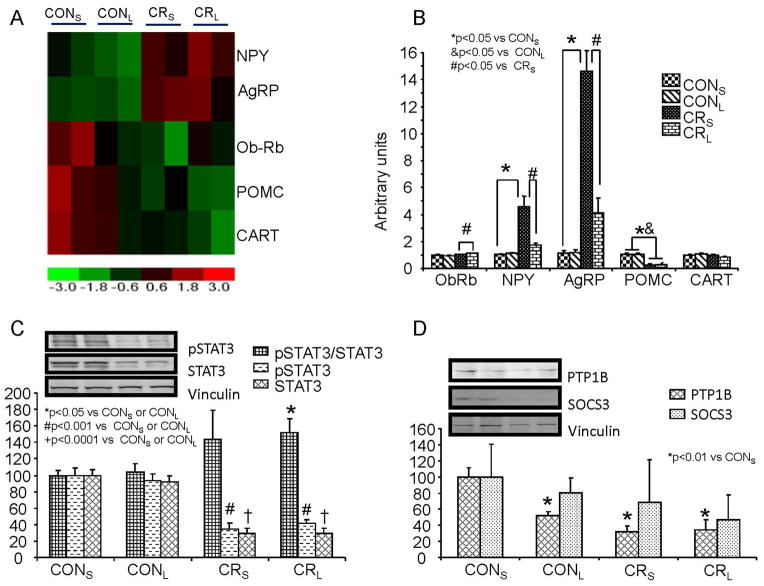
Figure 4. Hypothalamic gene expression profiles, validation of mRNA expression of hypothalamic neuropeptides and ObRb related signaling peptides.
A. Expression profile of hypothalamic orexigenic (NPY and AgRP) and anorexigenic (POMC and CART) neuropeptides in four experimental groups is shown (n=2 per group). The heat map displays CONS, CONL, CRS, and CRL labeled at the top of the columns. Rows demonstrate hypothalamic NPY, AgRP, ObRb, POMC and CART expression. At the bottom is the heatmap index, with red indicating up-regulation as compared to the control (CONS); green down-regulation as compared to control (CONS). NPY and AgRP are upregulated in CRS compared to CONS; ObRb, POMC and CART in CRS are downregulated compared to control (CONS). With leptin treatment in calorie-restricted pups (CRL), the degree of upregulation of NPY and AgRP appears blunted (lower) versus that seen in CRS (CRL<CRS). In contrast, ObRb reduction in CRL is much less than that seen in CRS (CRL>CRS), while the reduction in POMC and CART expression appears greater in CRL versus CRS (CRL<CRS). B. mRNA quantification by reverse transcription and real time PCR of hypothalamic ObRb and orexigenic and anorexigenic neuropeptides in four experimental groups at PN21 (n=12 per group). ObRb, no difference between CONS and CRS is observed. When leptin is administered, no effect is seen in CONL versus CONS, but a slight increase occurs in CRL vs CRS. NPY and AgRP, calorie-restriction (CRS) increased NPY and AgRP expression versus CONS, but leptin intervention (CRL) blunted this response (CRS) of NPY and AgRP, thereby approaching control (CONS) values. POMC, calorie restriction (CRS) had an opposite effect, decreasing expression versus control (CONS). No further change is seen with leptin (CRL versus CRS). No difference in hypothalamic CART expression was seen with either calorie-restriction (CRS) or leptin intervention (CRL). C & D. Western blot analysis demonstrates hypothalamic STAT3, phosphorylated (p)STAT3 (C), PTP1B & SOCS3 proteins (D) in four experimental groups at PN21 (n=6 per group). Calorie restriction (CRS) reduced STAT3 and pSTAT3, however no difference in the two groups was noted with leptin treatment (CONL versus CONS and CRL versus CRS). However, when the ratio of pSTAT3 to total STAT3 was examined, CRS, not significant, but CRL expressed an increase versus CONS and CONL. PTP1B, demonstrated a reduction in CONL, CRS and CRL versus CONS, however no difference between CRL and CRS was observed. SOCS3, while demonstrating a trend towards a decline in CONL, CRS and CRL versus CONS, was not statistically significant. The insets demonstrate representative Western blots with vinculin serving as an internal loading control. Separate blots are indicated by black boxes.

