
Figure 2.
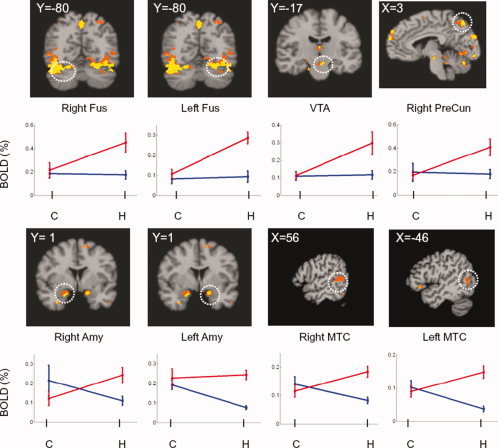
Activation maps resulting from factorial interactions and their corresponding BOLD signals at four factorial levels in individual regions of interest (ROI). The white circles in the maps indicate the regions with factorial interactions. The y‐axis represents the BOLD signal and x‐axis represents the subject‐factor for control subjects (C) and heroin‐dependent subject (H). The blue lines indicate the BOLD signals induced by the neutral‐cue and the red lines by the heroin‐cues. OFC, orbitofrontal cortex; Amy, amygdala; VTA, ventral tegmental area; FUS, fusiform cortex; PreCun, precuneus; MTC, middle temporal cortex. The regional significances of multiple paired t‐tests between four factorial levels were presented in Table II. The values of X and Y coordinates in the activation maps were the locations of the slices in the Talairach space.