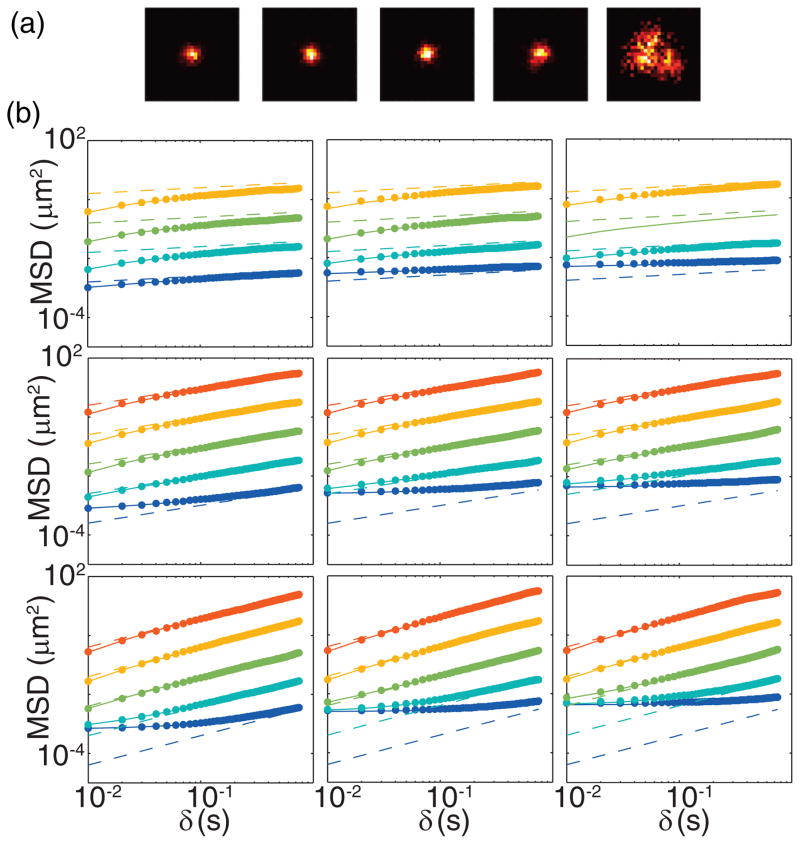
FIG. 2.
(Color online) (a) Example simulated images of particle diffusing within a single frame with α = 0.6, b = 0, and tE = 10 ms. From left to right D* is 10−3, 10−2, 10−1, 100, and 101. Pixel size = 160 nm. (b) Resulting MSDs from 2D simulation of FBM for various α (top to bottom rows: α = 0.2, 0.4, 0.6) and b (left to right columns b = 0, 50, 100), with p̄ = 500 and (from bottom to top in each panel:) D− = 10−3 (blue), 10−2 (cyan), 10−1 (green), 100 (yellow), and 101 (red) μm2/sα. Dots are simulated data, solid lines are theoretical predictions, and dashed lines are the predictions in the absence of errors.

