FIG. 3.
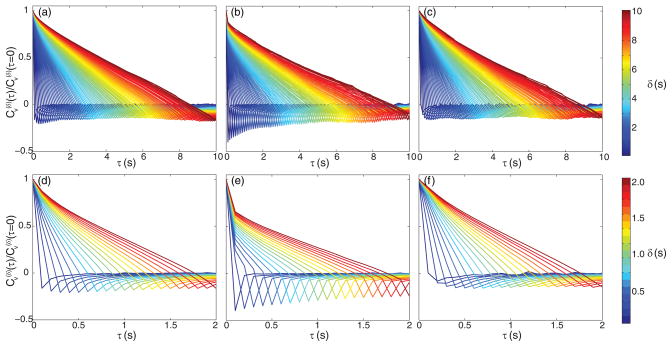
(Color online) Computed scaled VACs across various time scales for chromosomal locus data from the green channel [(a) and (d)], the red channel [(b) and (e)], and the cross-correlated data [(c) and (f)]). Bottom row depicts the same curves from the first 2 s as in the top row, zoomed in and with a different color scale. The color scales for the top and bottom rows are shown on the right. For reference in gray scale version, larger δ corresponds to a curve with negative peak further to the right.

