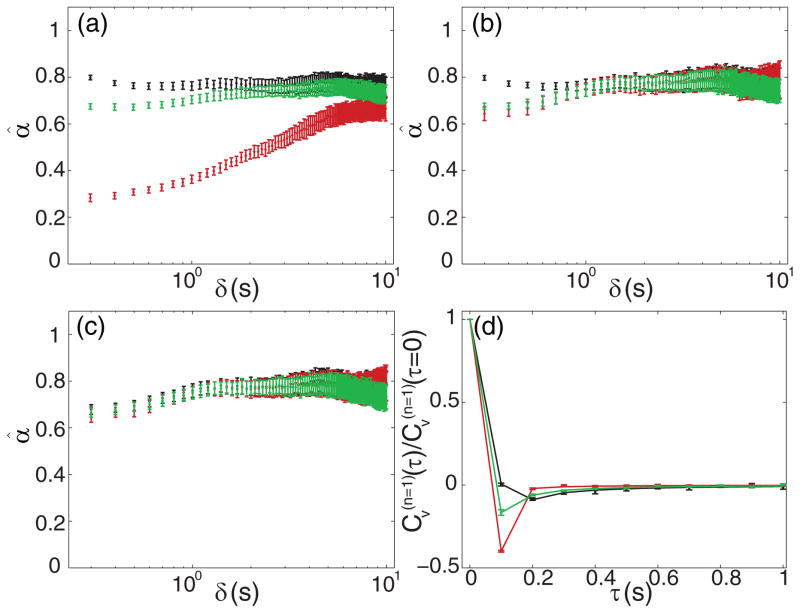
FIG. 4.
(Color online) Analysis of VACs from chromosomal loci data. All error bars are S.E.M. from 100 bootstrapped samples of the ensemble. Each panel depicts data from the green channel VAC (green or light gray), red channel VAC (red or darker gray), and cross-correlation (black). (a) Estimates of α resulting from naïve fits of the VACs without accounting for static or dynamic error. (b) Estimates of α resulting from taking static error into account, but not dynamic error. (c) Estimates of α taking both static and dynamic error into account. (d) Example computed and fit VACs for n = 1. Dots with error bars are computed from data; solid lines are fits taking static and dynamic error into account.

