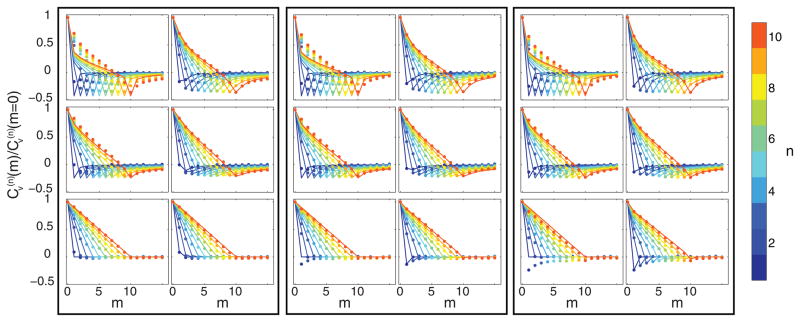
FIG. 5.
(Color online) Scaled VAC from simulated 2D data for various n, b, and α. Here tE = 10 ms, p̄ = 500 photons, D* = 0.1μm2/sα. Each black rectangle corresponds to a different b (from left to right: 0, 50, 100). Each row corresponds to a particular α (from top to bottom 0.2, 0.6, 1.0). Within a rectangle and row the left panel shows comparison of the data to the naïve VAC of Eq. (17) which does not take errors into account. The right panel shows comparison of the same data to the VAC in the presence of errors described in Eqs. (20)–(22). For reference in gray scale version, larger n corresponds to a curve with negative peak further to the right.

