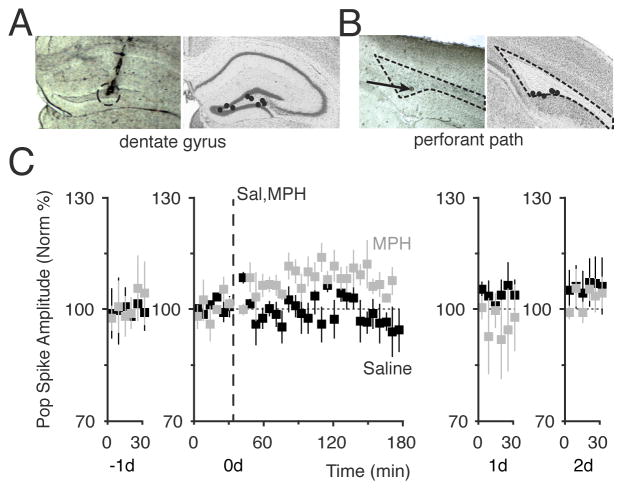
Figure 3.
High dose of MPH induced LTP. (A) Anatomical track verification of a recording electrode location in the dentate gyrus (dotted circle, left). The black dots show the range of recording locations in the dentate gyrus (right). (B) Anatomical lesion of a stimulating electrode in the medial perforant path (arrow, left). The black dots show the range of stimulation-site locations in the medial perforant path (right). (C) MPH-induced potentiation of the perforant path recorded in the DG (grey squares). The time course of each procedure is across 4 days, from the day before (−1d) until 2 days after (2d) the MPH administration. A 30 min baseline was obtained on −1d and confirmed to be stable for 30 min on day 0 (0d). Saline (black, n = 5) or 20 mg/kg MPH (grey, n = 5) was injected (i.p.) at 30 min on day 0 (vertical dashed line). The amplitudes of the population spike of the fEPSC are plotted over time for 4 days (−1d to 2d). Significant LTP was measured for 20 mg/kg MPH on 0d (F(2,389) = 7.8, p < 0.0005). The stability of the recordings and the return to baseline are shown on 1d and 2d.

