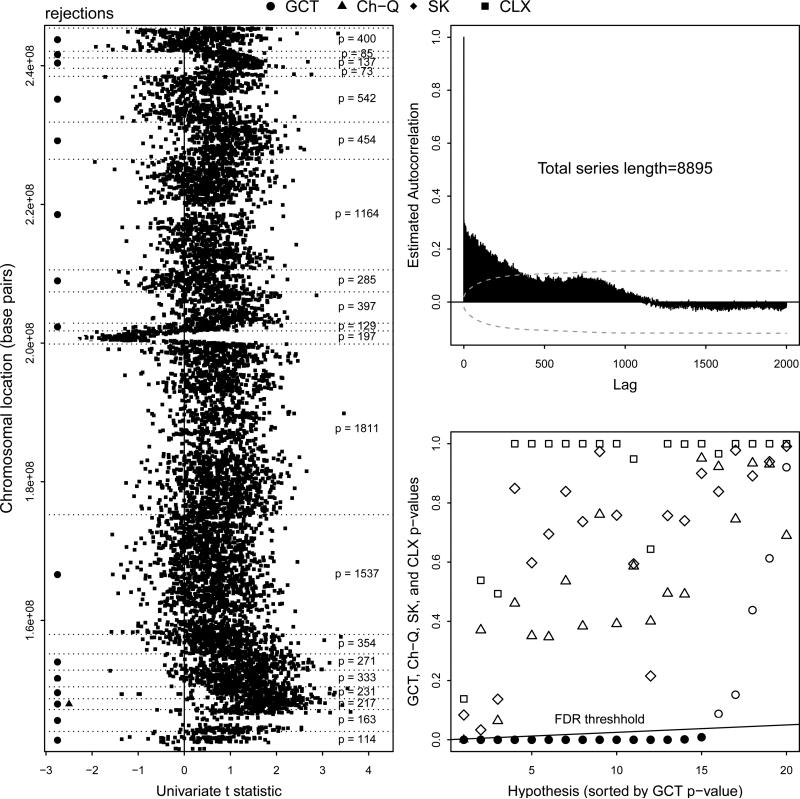
Figure 6.
(Left) Univariate t-statistics (tnj) plotted against base-pair location on q arm of chromosome 1. Filled symbols denote rejections from FDR procedure for the GCT, Ch-Q, SK, and CLX tests. The number of components p within each CBS-selected chromosomal region is shown. (Upper right) Estimated autocorrelation function for squared univariate t-statistics along q arm of chromosome 1 with large-lag confidence bands. (Lower right) FDR results, hypotheses sorted by GCT p-values. FDR rejection threshold shown with filled symbols denoting rejections.

