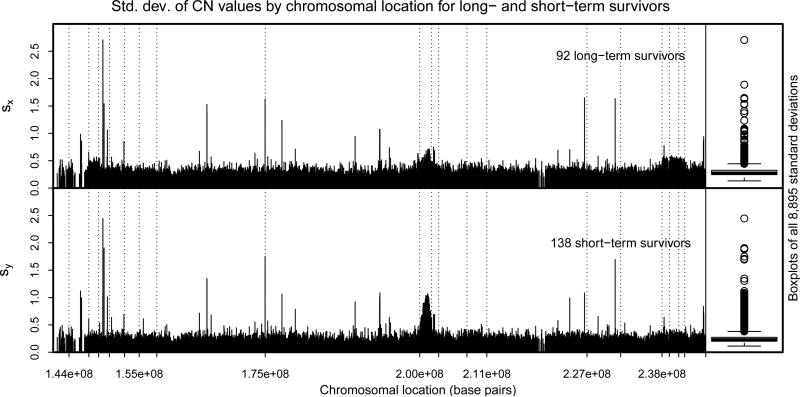
Figure 7.
Sample standard deviations of copy number at all 8,894 copy number locations for long- and short-term survivors with boxplots at right. Gaps occur at chromosomal locations where no copy number measurements were taken. Vertical dashed lines delineate the twenty CBS-selected regions in which the equal means hypothesis was tested.

