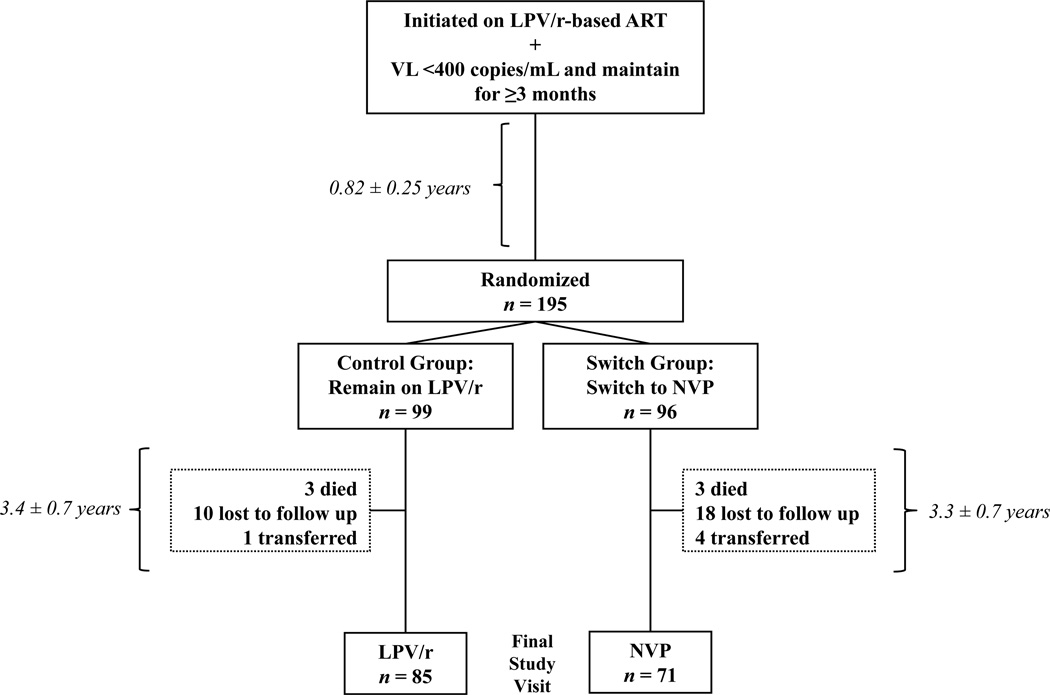
Figure 1.
Flow diagram of study participants in NEVEREST 2 (2005–2010) in Johannesburg, South Africa detailing the number of subjects excluded from the analysis, the reason for their exclusion, and distribution of included subjects by randomization group. Time intervals are provided in mean ± standard deviation.

