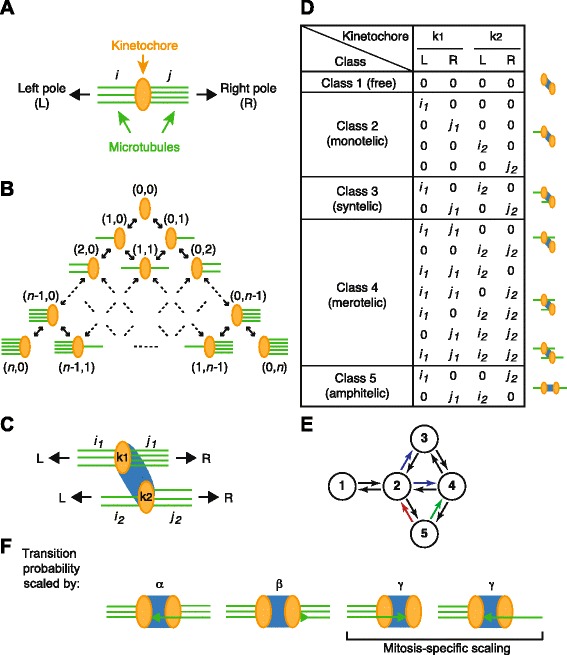
Fig. 1.

A discrete-time Markov chain model of kMT dynamics. a Schematic diagram of the interaction between a kinetochore (orange) and microtubules (green) from either left (L) or right (R) pole. i and j indicate the number of kMTs. b Kinetochore–microtubule interactions as a Markov chain. The maximal number of kMTs per kinetochore is n. c Schematic diagram of kMT dynamics during cell division. A pair of kinetochores (k 1 and k 2) are connected by bivalent chromatids in meiosis I or centromere chromatins (blue). d States of the kinetochore–microtubule complex are defined with r n(i 1,j 1,i 2,j 2). Every state can be classified into one of five classes in the table. Schematic diagrams of each class are shown on the right. e Transition diagram among classes. A subset of states in the Markov chain categorised in (d) can move from one class to another according to this diagram. To increase the probability of class 5 states, transitions out of class 5 (red and green arrows) must be reduced, the probabilities of which are scaled with parameters α (for the green arrow) and β (for the red arrow) in the model. In mitosis, transitions from class 2 to class 3 or 4 are scaled with γ (blue arrows). f Schematic diagram of the scaling by parameters α, β and γ. Probabilities of state transition by attachment or detachment (arrowheads) are scaled by the indicated parameters
