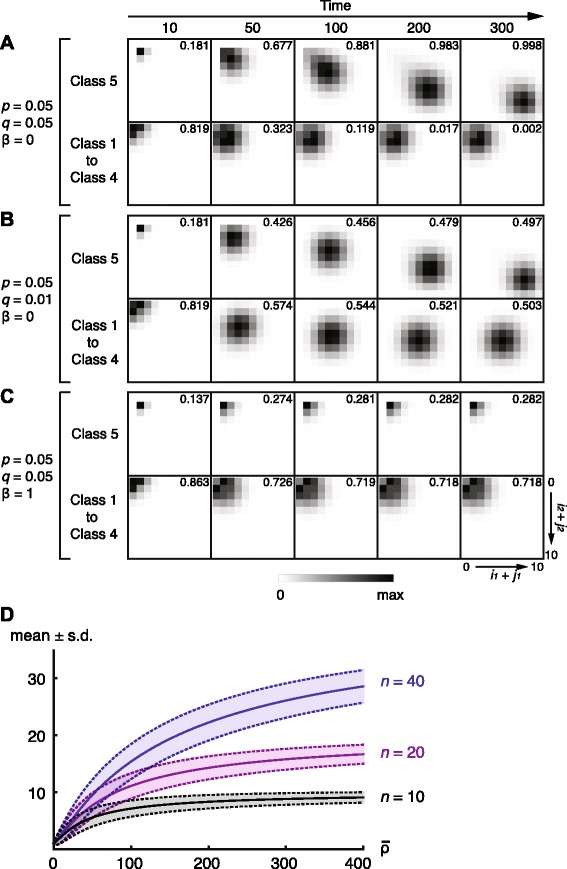
Fig. 3.

Probability distribution of the number of kMTs over time. a–c Probability density plots of the number of kMTs in meiosis I in 2D (i 1+j 1 vs. i 2+j 2; see Fig. 1 c) at the indicated time points. Parameters are indicated on the left. α=0, n=10 for all panels. Probabilities are decomposed into class 5 and the rest (class 1 to 4) at each time point. Total probabilities are indicated on each panel. The densities are scaled from 0 to the maximal for each panel. d Mean number of microtubules (± standard deviation) attached to a kinetochore derived by the approximation formulae (Eq. (3) and Additional file 1: Eq. (10)). Plots for n=10, 20 and 40 are shown. For details, see Additional file 1
