
Fig. 9.
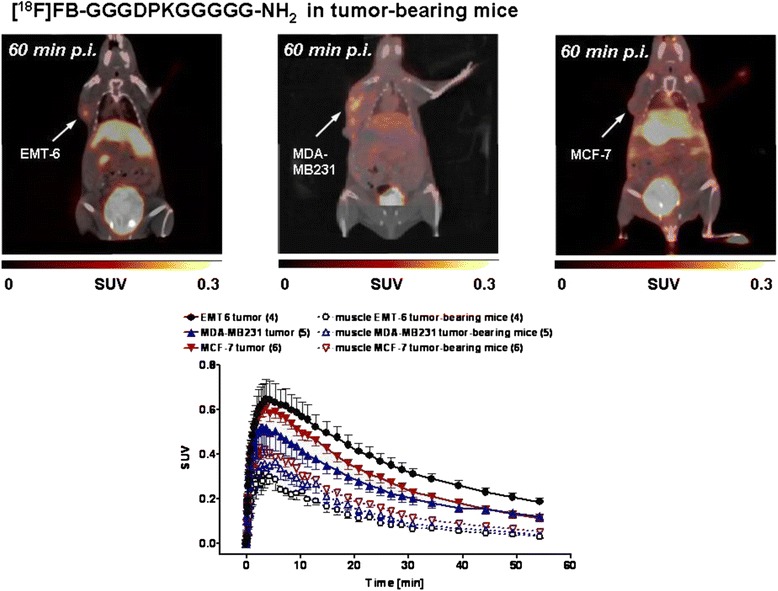
Top: Representative positron emission tomography/computed tomography of EMT-6, MDA-MB-231 and MCF-7 tumor-bearing mice 60 min after injection of [18F]fluorobenzoate ([18F]FB)-GGGDPKGGGG-NH2. Images are shown as maximum intensity projections. Bottom: Time–activity curves for the radioactivity detected in EMT-6, MDA-MB-231 and MCF-7 tumors in comparison with the uptake levels in muscle tissue after injection of [18F]FB-GGGDPKGGGGG-NH2. Data are presented as mean ± standard error of the mean. p.i. postinjection, SUV standardized uptake value