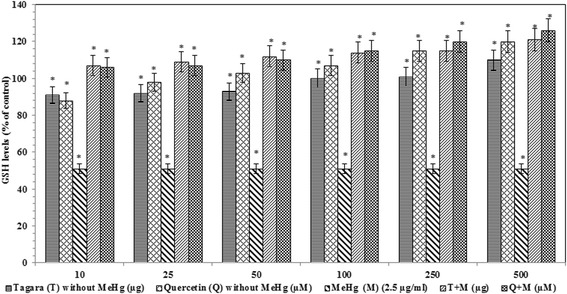
Fig. 4.

Glutathione contents in treated and untreated groups with Tagara. Data are expressed as percentage of control. Values are represented as mean ± standard error. *indicates statistically different from control (P < 0.05)

Glutathione contents in treated and untreated groups with Tagara. Data are expressed as percentage of control. Values are represented as mean ± standard error. *indicates statistically different from control (P < 0.05)