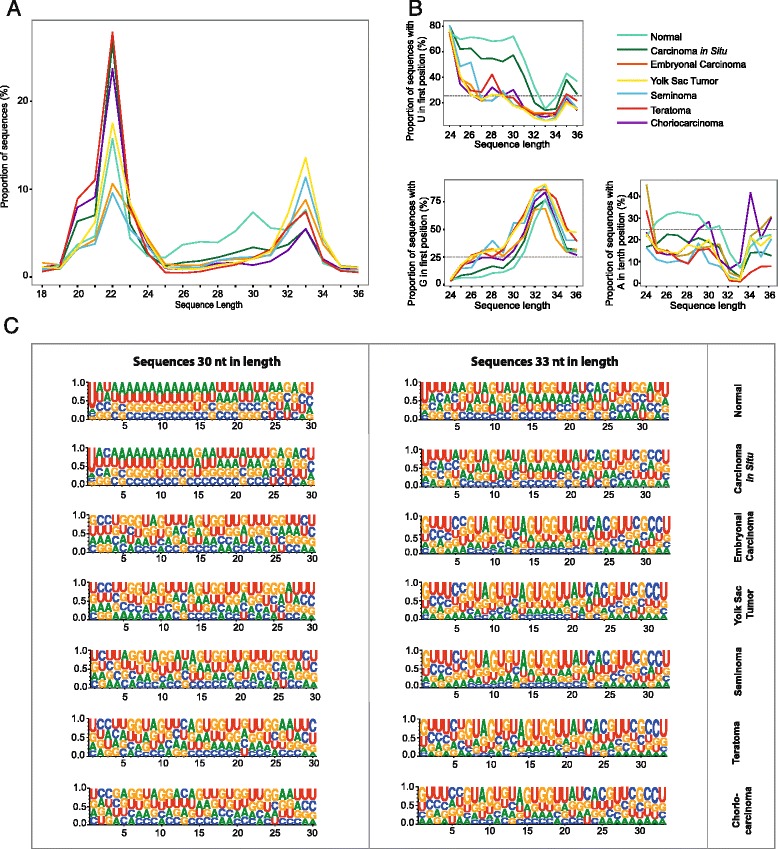
Fig. 1.

Small RNA length distribution and base compositions in normal and TGCT samples. a Small RNA sequence length distribution in each sample group (sequences 18–36 nt in length) based on normalized counts in each sample. b The percentage of reads aligning to the human genome with U in first position, G in first position, and A in 10th position for unique small RNA sequences 24–36 nt in length in each sample group. The horizontal line at 25 % in the plots represents the expected base proportion under random distribution. C Web logos for unique, trimmed sequences 30 and 33 nt in length showing the base composition in each nucleotide position. The X-axis represents the nucleotide position relative to the 5′ end, whereas the Y-axis represents the entropy score for the base bias
