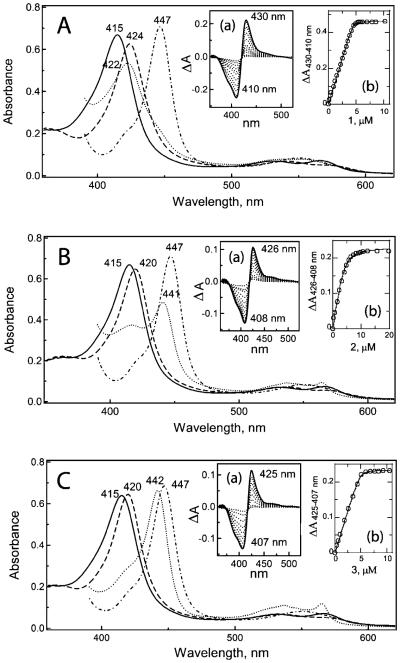
Figure 2.
Spectral changes induced in CYP3A4 upon binding of 1 (A), 2 (B), and 3 (C). Absorbance spectra of ferric ligand-free (–), ligand-bound (---), ferrous ligand-bound (…), and ferrous CO complex (-·-·-·) were recorded at room temperature in 50 mM phosphate buffer, pH 7.4, containing 20% glycerol and 1 mM dithiothreitol. Insets (a) and (b) are absorbance changes observed during titration of CYP3A4 with 1–3 and plots of absorbance change vs ligand concentration, respectively.

