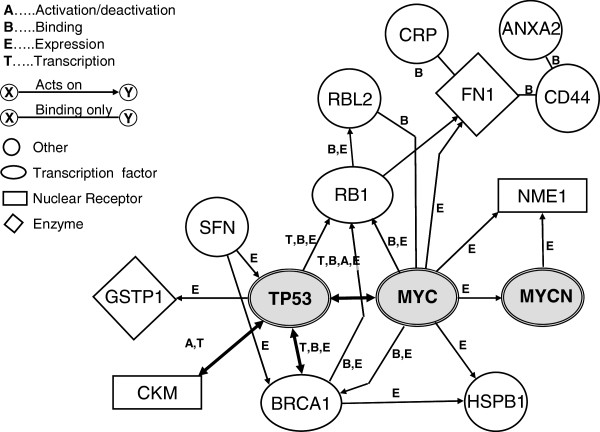
Figure 3.

Schematic result of proteomics study analysed by pathway analysis. The diagram was constructed with the use of the Ingenuity Pathway Analysis software as described in the ‘Methods’ and ‘Results’ sections. ANXA2, annexin A2; BRCA1, breast cancer 1; CKM, creatinine kinase M-chain; CRP, c-reactive protein; FN1, fibronectin 1; GSTP1, glutathione S-transferase pi; HSPB1, heat shock protein 27; NME1, nucleoside diphosphate kinase A; RB1, retinoblastoma; RBL2, retinoblastoma-like protein 2; SFN, 14-3-3sigma, stratifin.
