


Fig. 3.
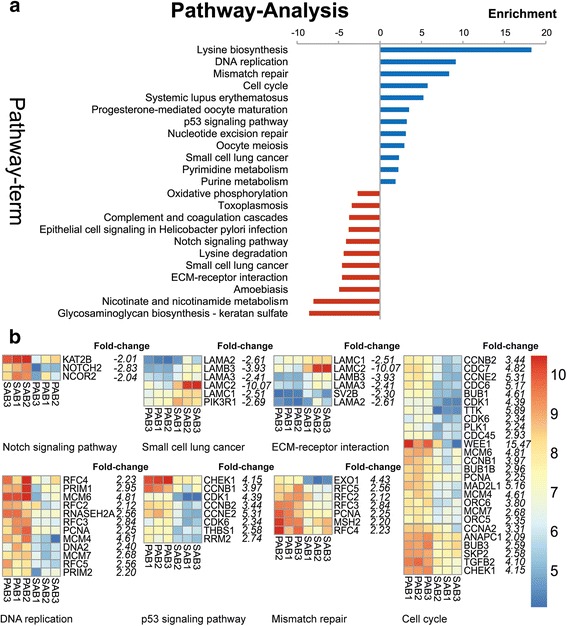
KEGG pathway analysis. a. KEGG pathway enrichment analysis was performed by Fisher exact test. Significantly enriched KEGG pathways (p < 0.05) are presented. For each KEGG pathway, the bar shows the fold-enrichment of the pathway. b. The expression intensity of genes in the selected KEGG pathway. The italic values on the right of gene names were the fold changes of corresponding genes in PABs compared to SABs