


Fig. 4.
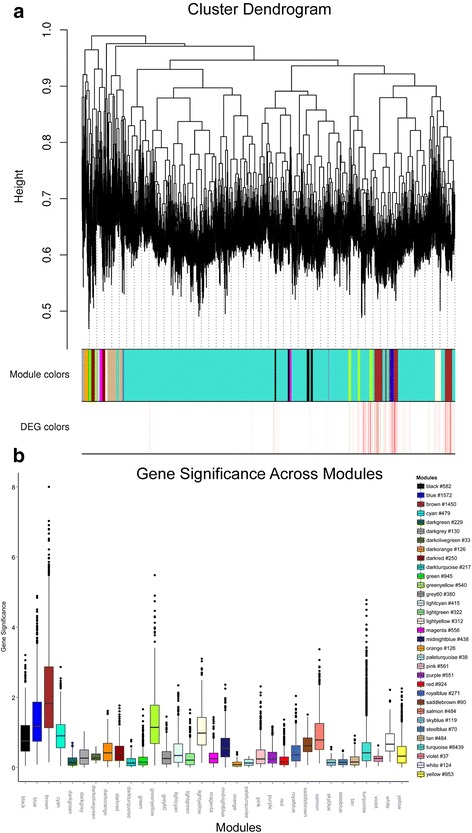
Gene coexpression modules and assigned module colors. a. Clustering dendrogram of genes with the x-axis corresponding to each gene and the y-axis representing the dissimilarity based on topological overlap of the whole genome throughout ameloblast differentiation. Top color bar: modules were assigned colors corresponding to different dendrogram branches detected by a cluster algorithm. Second color bar: each gene was annotated with DEG information such that significantly up-regulated genes in PABs are marked with red bands and genes down-regulated in PABs marked with green bands. b. Boxplot depicting gene significance defined as -log10(p-value) of each module. The left legend indicates module colors and the number of genes (stars with a number sign) in the corresponding module (for example, 1527 genes in the blue module)