
Fig. 3.
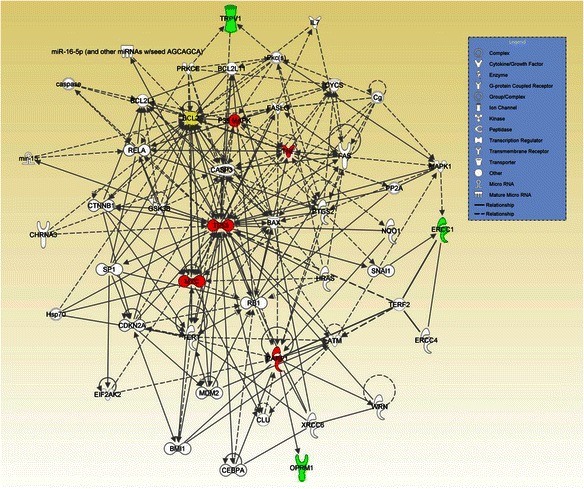
The most significant network (p value = 10−8) generated by IPA core analysis for 7 focus genes associated with platinum/taxane-induced neuropathy. Green: focus genes; red: genes with at least 15 connections; yellow: focus genes with at least 15 connections. Dashed and solid lines represent indirect and direct interactions, respectively