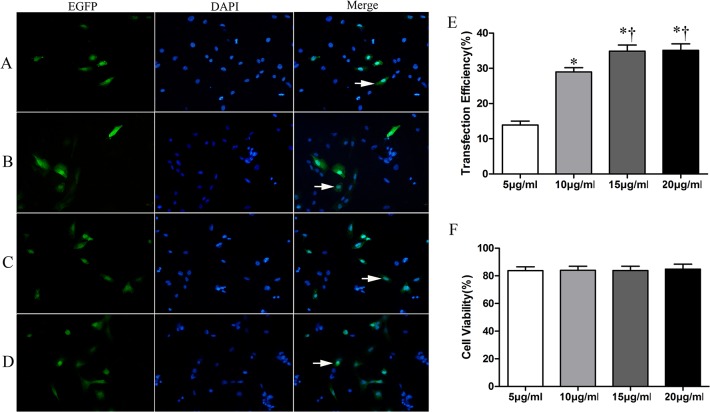
Fig 4. The effect of PC on transfection efficiency and cell viability.
A-D showing EGFP expression at PC 5 μg/ml,10 μg/ml,15 μg/ml, 20 μg/ml in sequence. E showing transfection efficiency at different PC with when MC (30%), AI (1.5 W/cm2), and ET(30 s) were fixed. F cell viability at different PC with when MC (30%), AI (1.5 W/cm2), and ET (30 s) were fixed. Indication: Symbols indicate significant differences (P< 0.05) from ET of 5 μg/ml(*) or 10μg/ml (†).

