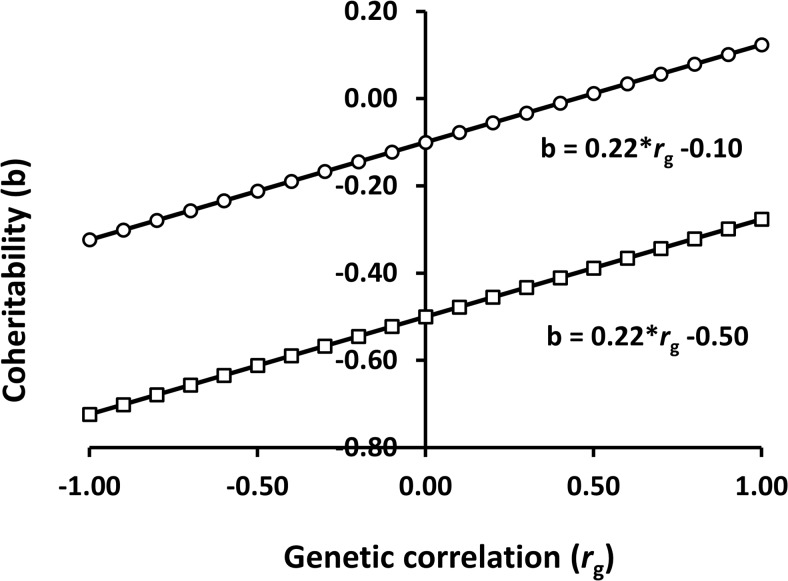
Fig 2. Relationship between coheritability, heterogeneity of additive genetic variances and the genetic correlation between environments.
The input parameters are a trait that has different magnitudes of heritability; 0.1 (line with circles) and 0.5 (line with squares) in two different environments (E 1 or E 2) and phenotypic variances are equal to 1. The genetic correlation ranged from -1 to 1. Line graphs show that heterogeneity of additive genetic variances results in different values of coheritability because h 2 int (0.1 or 0.5) changes, depending on the intercept which is placed in either E 1 or E 2.

