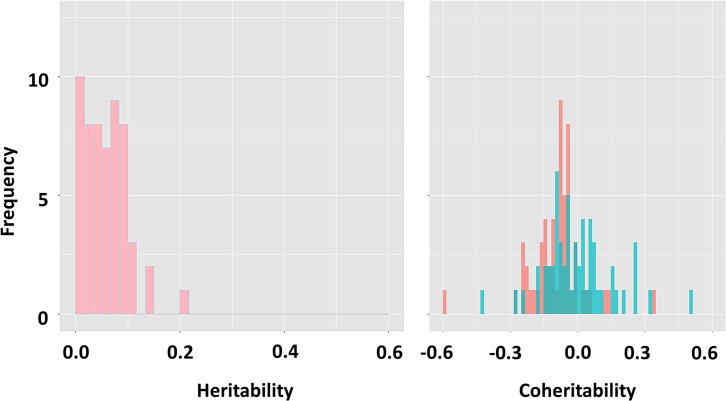
Fig 5. Histogram of heritability and coheritability for macroenvironmental sensitivity of growth traits obtained from previous GxE studies in aquaculture.
The coheritability differs in different environments. The light red and light green bars show two distributions of coheritability in two different environments. The dark green bar indicates the position that two histograms overlap.

