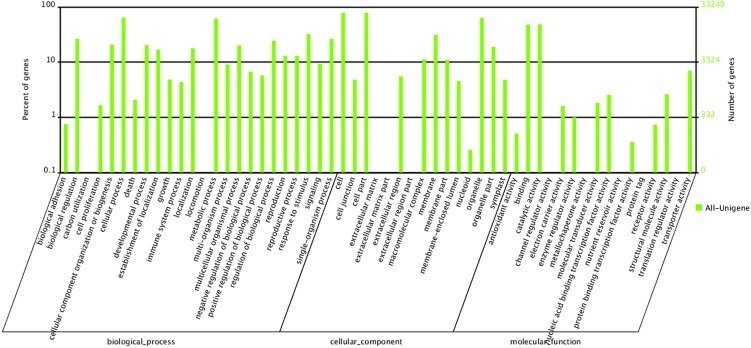
Fig 1. Gene ontology (GO) classification for the P. delavayi transcriptome.
The transcripts (33,249) were categorized into 55 function groups. The right y-axis indicates the number of genes in a category, whereas the left y-axis indicates the percentage of a specific category of genes in the corresponding main category.

