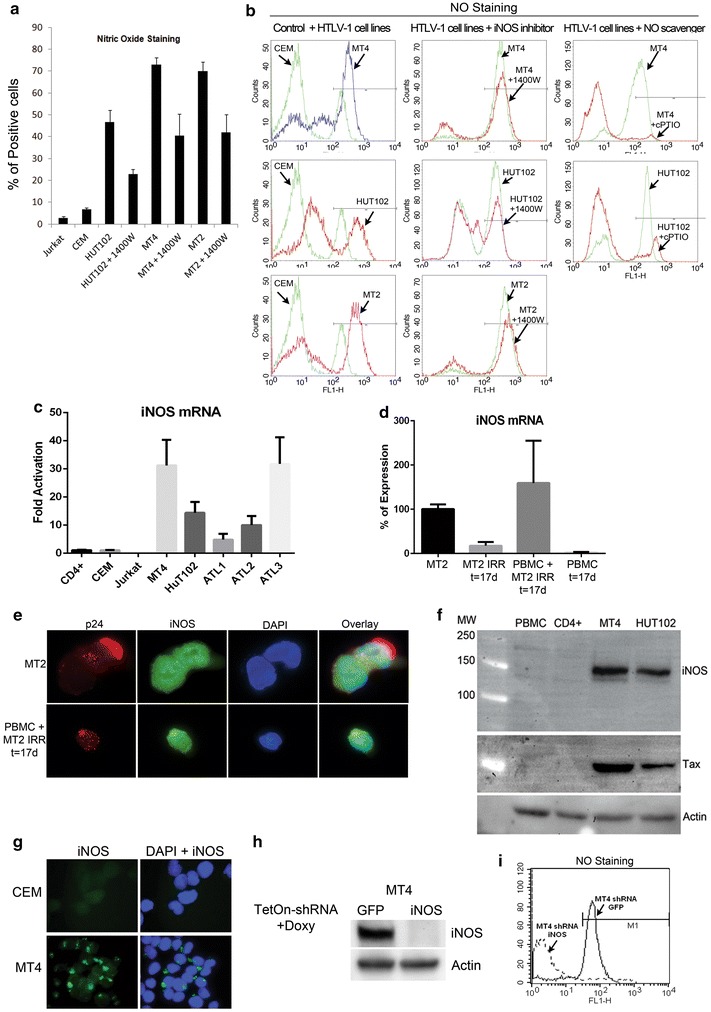
Fig. 1.

High levels of NO and iNOS are detected in HTLV-1 transformed cell lines and ATLL patients’ samples. a HTLV-1 transformed cell lines MT2, MT4, and HuT102, and transformed human T-cell controls Jurkat and CEM treated with DMSO or with 1400 W, an iNOS selective inhibitor, were stained with DAF-2DA to measure the intracellular pool of NO. The histograms represent the average of three different experiments with the indicated standard deviations. b Flow cytometry analyses of the intracellular pool of NO shows the difference between control cells and HTLV-1 infected cell lines (1st column), HTLV-1 infected cells untreated or treated with iNOS inhibitor, 1400 W (2nd column), and HTLV-1 infected cells untreated or treated with NO scavenger, cPTIO (3rd column). c qRT-PCR of the intracellular pool of iNOS mRNA showed a specific increase in HTLV-1 infected cells and in ATLL patients’ samples but not in the control CD4+, Jurkat, and CEM cells. GAPDH was used as an internal control for mRNA quantification. d Real-time measurement of iNOS mRNA of freshly infected PBMCs with irradiated MT2 cells. iNOS mRNA pool is shown in irradiated MT2 cells alone, non-irradiated MT2 cells, and in uninfected PBMCs at 17 days of infection. e Immunoflurescence staining of Gag protein, p24, and iNOS in MT2 and freshly infected PBMC at 17 days of infection. f Western blot analysis of iNOS protein expression shows the expression of iNOS in MT4 and HuT102 cell lines but not in the control PBMC or CD4+ primary cells. g Immunofluorescence staining of iNOS protein in CEM control cells and in HTLV-1 transformed human MT4 cells. h MT4 cells expressing inducible TetOn control shRNA (GFP) or TetOn shRNA directed against iNOS mRNA were established, and iNOS expression was measured by Western blot. i NO measurement by DAF-2DA showing that depletion of iNOS expression by shRNA reduces completely the production of NO.
