
Fig. 1.
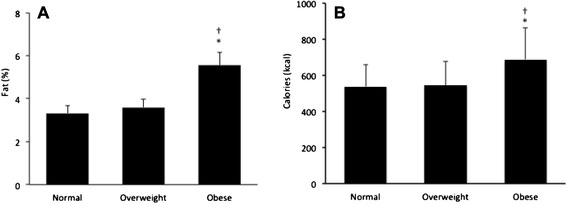
Fat a and calories b in the colostrum of normal, overweight and obese mothers. Data presented as mean ± standard error (SE). F(A) = 7.27; p = .005; F(B) = 6.90; p = .003. *Statistically significant differences between normal and obese groups. †Statistically significant differences between overweight and obese groups