
Fig. 2.
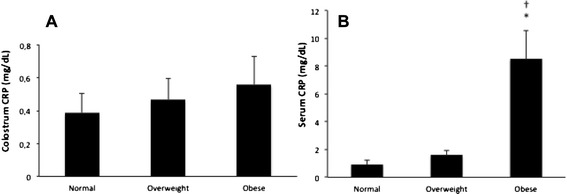
CRP concentrations in the colostrum a and serum b of normal, overweight and obese mothers. Data presented as mean ± standard error (SE). F = 12.30; p = .002 comparing the groups; F = 20.71; p = .001 comparing the samples (colostrum and serum). * Statistically significant differences between normal and obese groups. †Statistically significant differences between overweight and obese groups