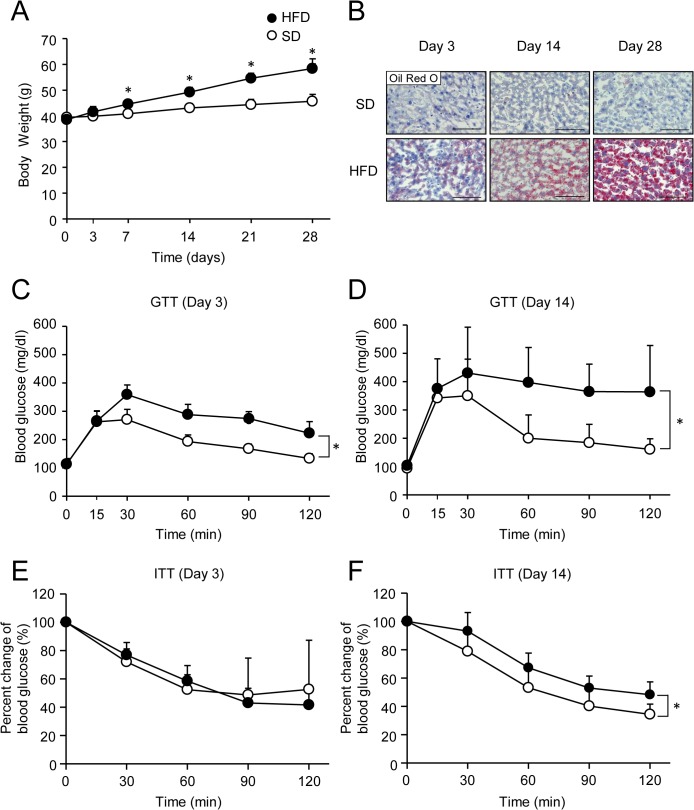
Fig 1. Development of obesity, liver steatosis, glucose intolerance, and insulin resistance in high fat diet-fed mice.
(A) Body weight in mice fed a standard diet (SD; white circles) or high fat diet (HFD; black circles). Results are means ± standard deviation. Error bars are smaller than the symbols. n = 5 per group. *P < 0.05. (B) Oil Red O-stained liver sections from SD- or HFD-fed mice. Scale bar, 100 μm. (C and D) Intraperitoneal glucose tolerance test (GTT) in SD- or HFD-fed mice on day 3 (C) or day 14 (D). (E and F) Insulin tolerance test (ITT) in SD- or HFD-fed mice on day 3 (E) or day 14 (F). Results are means ± standard deviation. n = 5‒8 per group. *P < 0.05.

