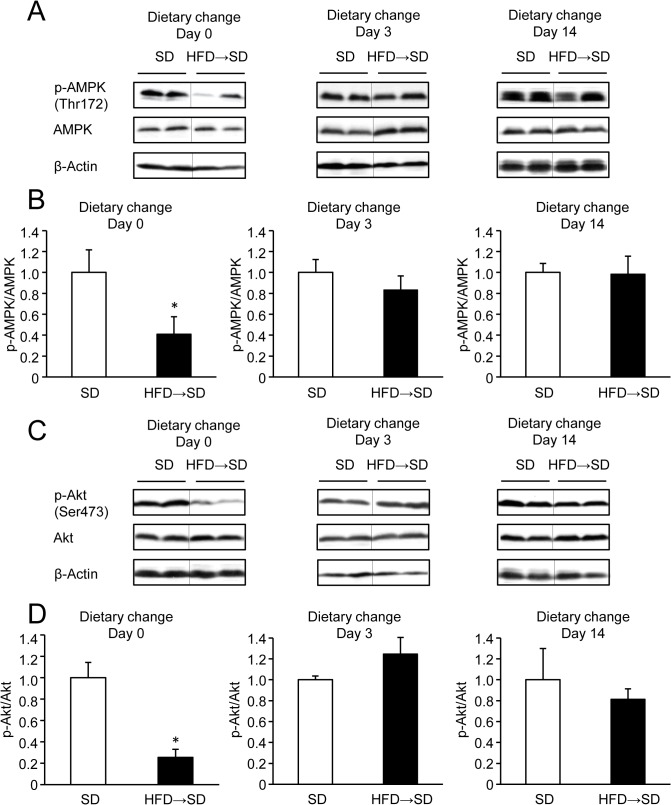
Fig 4. Hepatic AMPK and Akt phosphorylation levels in mice subjected to dietary change or SD.
(A and B) Representative western blot quantification of AMPK phosphorylation (relative to total AMPK protein). n = 4‒5 per group. (C and D) Representative western blot quantification of insulin-stimulated Akt phosphorylation (relative to total Akt protein). n = 4‒5 per group.

